2024 Sustainability Report
Climate leadership
Domain: Amplifying action through campus and communities
Aspiration to 2030: Through demonstration of its operations, the University has catalysed ambitious climate action by others.
Progress against targets
| Target | Target status | Progress in 2024 |
|---|---|---|
| The University is certified carbon neutral by 2025[1]. |  On track |
|
| The University has achieved climate positive status by 2030. |  Not yet started | This will follow achievement of 2025 carbon neutral target (above). |
Explore our progress
and our stories
Our progress
Greenhouse gas emissions
In 2024, the University focused heavily on improving data quality across several of its largest emissions sources including purchased goods and services, capital goods, and flights. Collectively, these emission sources made up 70 per cent of the University's gross GHG emissions. More accurate data will enable emission reduction actions that will support our climate leadership targets.
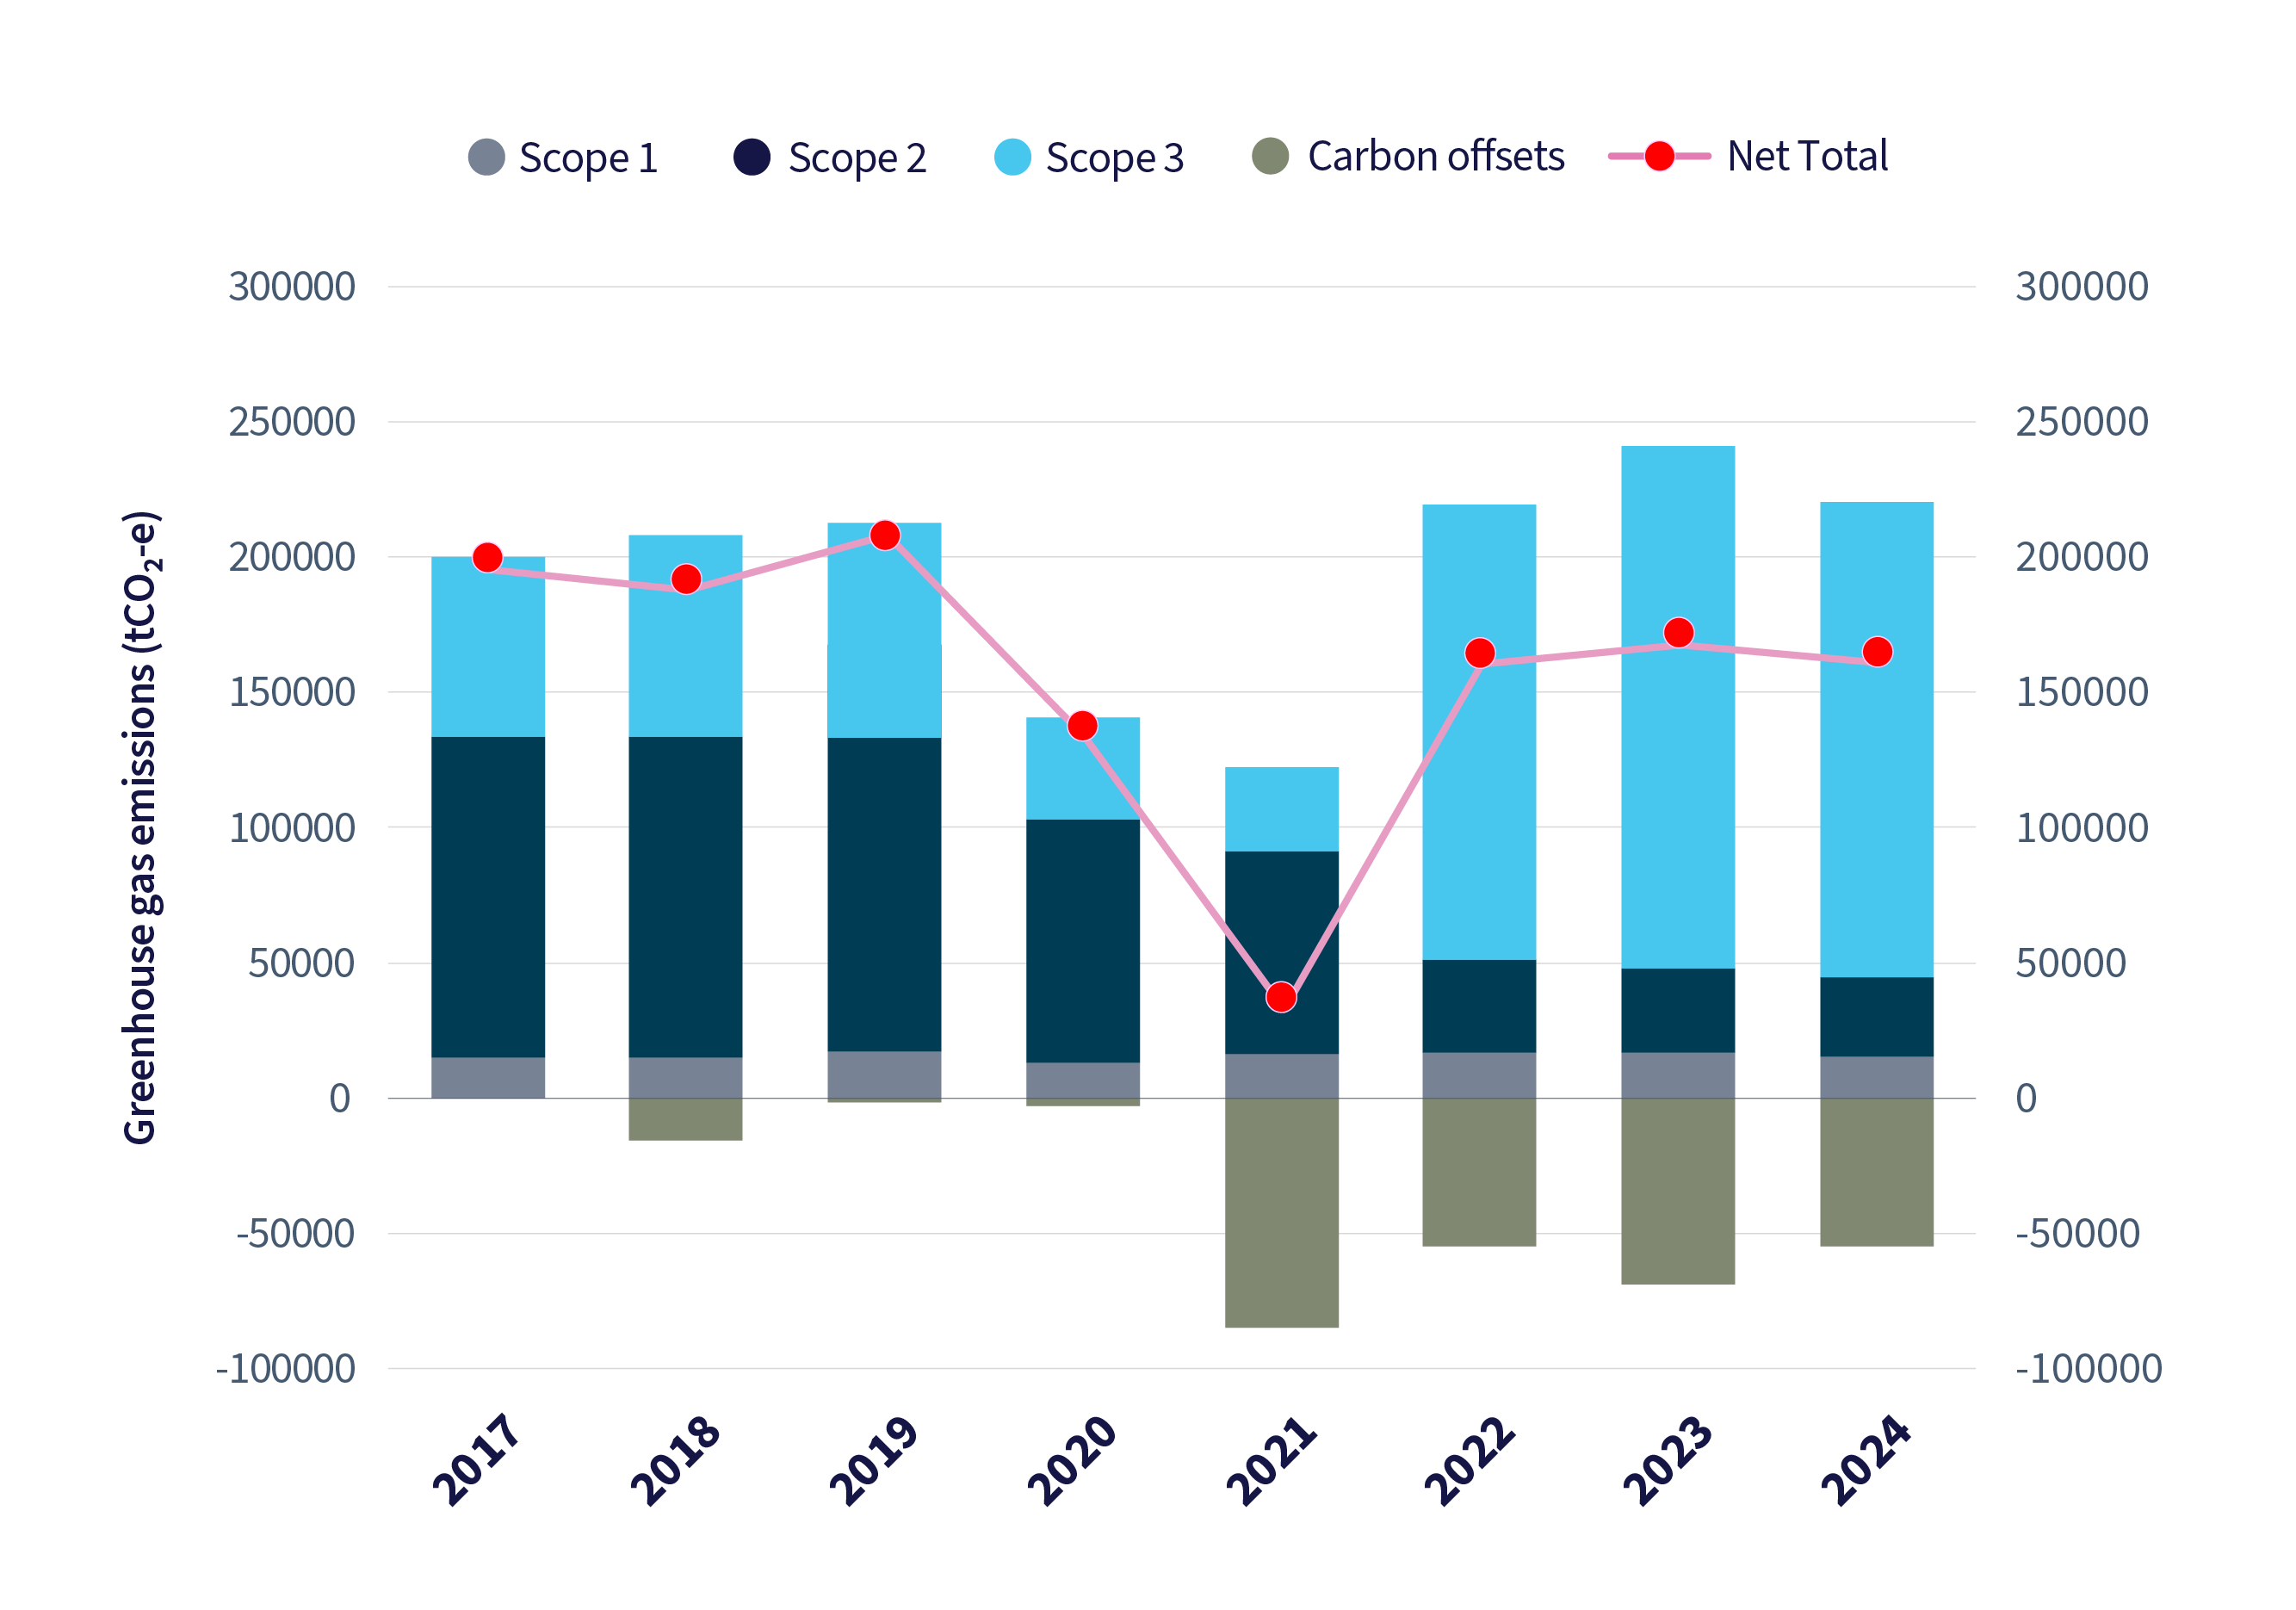
Overall, our gross carbon emissions for 2024 were 220,239 tonnes of carbon dioxide equivalent (tCO2-e). This was a decrease of 20,899 tCO2-e from the 2023 level. The University purchased 54,783 tonnes of carbon offsets, resulting in net emissions for 2024 of 165,457 tCO2-e.
UoM greenhouse gas emissions | 2017-2024
Our 2024 Scope 1 emissions, generated from consumption of natural gas, liquefied petroleum gas (LPG), fuel for our vehicle fleet and refrigerants, were seven per cent below 2023 levels.
This reduction can be attributed to three core reasons. Firstly, our emissions from refrigerants reduced significantly, due to the sale of a facility that contributed heavily to refrigerant emissions. Secondly, there was a decrease in overall fleet travel from petrol and diesel vehicles. Finally, as part of the ongoing electrification of natural gas and LPG infrastructure across the University's campuses, LPG was almost entirely removed from Dookie campus facilities, with only a minimal residual amount used for bunsen burners and other scientific equipment.
Scope 2 (indirect) emissions from purchased energy
The University consumed 70 per cent renewable electricity in 2024 and again met our target of zero net emissions from electricity. To achieve this, we voluntarily retired approximately 58,000 renewable energy certificates (LGCs), sourced primarily from our wind farm Power Purchase Agreements (PPAs), and purchased 32,690 tonnes of carbon offsets. Details of our offset purchases are here. The University has developed a Carbon Offset Procurement Framework, which outlines principles and a process to maximise our impact from carbon offset procurement. Read more about the framework here.
Scope 3 (indirect) emissions from our supply chain
The University's gross scope 3 carbon emissions reduced from 193,049 tCO2-e in 2023 to 175,745 tCO2-e in 2024, largely due to a decrease in reported emissions from business flights. Unitravel, the University’s travel provider, changed its flight emissions calculation to use Thrust Carbon. The Thrust Calculator is the first and only tool independently assured to the new ISO 14083 standard for quantifying and reporting greenhouse gas emissions arising from transport chain operations. It calculates GHG emissions specific to each flight, by class, distance, aircraft type, radiative forcing and occupancy rate. This means that the 2024 reported emissions are the result of a different and more accurate methodology than that used previously. When calculations by Thrust Carbon were compared to those using standard industry-wide emission factors, reported emissions via Thrust Carbon were approximately 39 per cent lower. In addition, we worked with Unitravel to make the carbon emissions of each flight option visible to travel bookers at the time of booking, enabling more informed travel choices.
The University's employee commuting and working from home emissions also decreased between 2023 and 2024. Our updated 2024 employee commuting survey showed a reduction in the distance staff travelled by carbon intensive transport modes (e.g. petrol and diesel combustion vehicles) and the distance travelled overall. Staff also reported spending fewer days working from home.
The University also saw a reduction in reported emissions from procurement and construction related activities in 2024 compared with 2023. This reduction is in part due to the University's ongoing efforts to improve data quality across these activities. Supplier-specific carbon emissions were captured for several procurement activities, and a life-cycle assessment (LCA) was conducted for the Dookie student accommodation, providing a more accurate estimate of the embodied carbon in the building’s construction.
For access to other GHG data please click on these respective links: GHG emissions by category 2024, GHG emissions by scope, GHG emissions by FTE, EFTSL, and Gross floor area .
FOOTNOTES
[1]Climate Active carbon neutral certification.
Energy
The University’s energy demand remained steady in 2024, with electricity consumption increasing by two per cent and natural gas consumption decreasing by one per cent. Liquid petroleum gas (LPG) consumption decreased by 81 per cent due to the electrification of the Dookie campus. Onsite solar generation increased by nine per cent to 3,795 MWh due to the addition of panels across the Burnley campus and the Western Precinct at Parkville.
Renewable electricity generated by wind farms under the University’s two Power Purchase Agreements (PPAs) was 73,797 MWh in 2024, similar to 2023. By voluntarily retiring renewable energy certificates, the University ensured that 70 per cent of its total electricity consumption was from renewable sources.
The University continued to invest in improving energy performance and reducing energy-related emissions. Notably, three projects were delivered as part of the gas electrification program in 2024. Two buildings at the Parkville campus and the Dookie campus, were electrified, reducing future gas consumption (natural gas and LPG) by the equivalent of 6,780 GJ per annum.
Total energy consumption by source | 2017-2024

Click here to see data table of dataset used above
Total electricity usage | 2017-2024

Click here to see data table of dataset used above
UoM staff commuting patterns, 2019-2024

Our stories
Spearheading building electrification on the Parkville campus
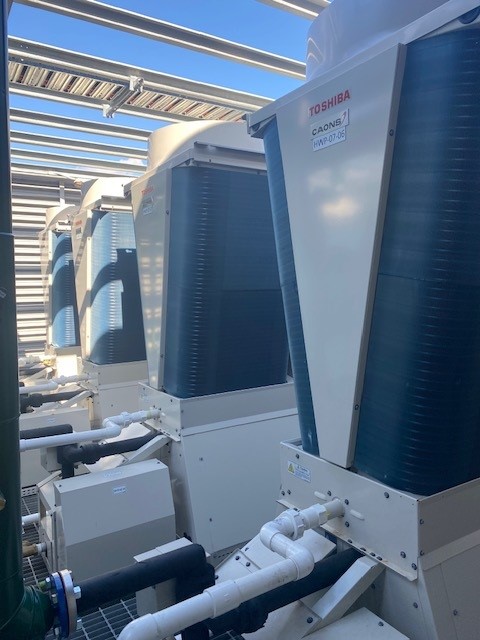
The University is advancing its energy transition through its Electrification Program, systematically replacing gas-burning equipment with electric alternatives. Eliminating gas demand is both a financial and environmental priority and imperative, and the program aims to phase out gas use across all campuses through targeted end-of-life asset replacement over the next 10 years.
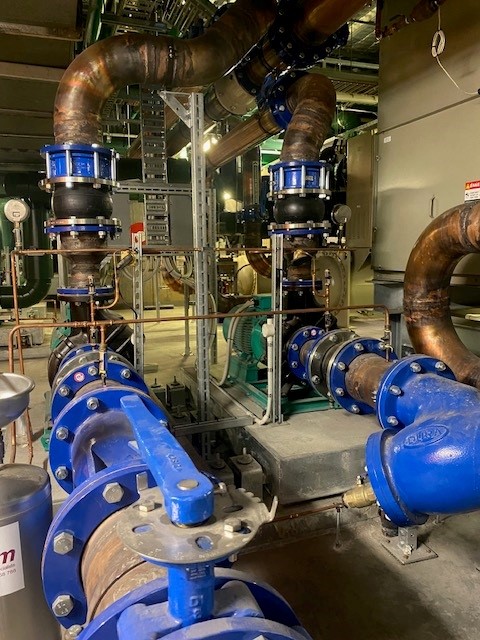
In 2024, the Faculty of Business and Economics (FBE) building and Chemical Engineering 1 (B165) were fully electrified, eliminating five terajoules of gas consumption - an equivalent to two per cent of Parkville campus usage. The project involved decommissioning ageing heating and cooling systems and replacing them with efficient electric solutions, including heat pumps. This improved energy efficiency, reduced the University’s carbon footprint, and enhanced operational savings and indoor environmental quality.
Looking to the future, the University is committed to delivering new projects as all-electric facilities while progressively transitioning existing buildings away from gas dependency. This approach to gas asset removal aligns with and will help shape broader community and industry practices.
Leveraging data analytics to drive energy efficiency
The University is leveraging its campus as a living laboratory to drive sustainability and energy efficiency. In 2023-2024, Campus Management hosted four data analytics students in a project focused on modelling the University's future energy consumption. The goal was to improve budgeting accuracy and gain insights into energy usage patterns to assist with electricity purchasing certainty and point to efficiency savings.
The students successfully developed robust statistical models capable of forecasting energy use at both building and campus levels. These models have proven invaluable in informing as well as measuring and verifying the impact of energy efficiency upgrade projects. For example, heating, ventilation, and air conditioning (HVAC) upgrades in the Baillieu Library on the Parkville campus had verified energy savings of 2.7 Gigawatt hours per annum, enough to power approximately 400 houses for a year. The ability to understand energy consumption behaviours through statistical modelling allows the University to detect buildings with inefficient consumption patterns. The living laboratory experience has also equipped students with practical skills in data analysis, energy forecasting, and the application of statistical methods to real-world sustainability challenges, preparing them for future careers.
Our sustainability strategy
At the University of Melbourne, our efforts in sustainability are guided by Sustainability Plan 2030 - a roadmap for sustainable delivery of our institutional strategy Advancing Melbourne.
Read more about how we are advancing sustainability at the University:
