2024 Sustainability Report
Responsible investments
Domain: Walking the talk in our operations
Aspiration to 2030: The University’s investment portfolio and strategies support our aspiration to be leaders for a sustainable future.
Progress against targets
| Target | Target status | Progress in 2024 |
|---|---|---|
| The University’s investment portfolio[1] will be included in our commitment to be climate positive by 2030. |  Not yet started |
|
| Enhanced transparent reporting of the University’s investment portfolio. |
In progress |
In 2024, for the listed Australian Equities and International Equities components of the University’s Investment Portfolio, we are reporting on: The University is exploring ways to estimate the carbon emissions of the balance of the Investment Portfolio. |

For the most part, the University’s investment portfolio is managed separately to our operational balance sheet and core activities. The investment model for financial assets is predominantly outsourced, consistent with our investment scale and focus on leadership and excellence in education and research. The prudent and responsible investment of the University’s accumulated financial resources, and funds donated to the University, underpin the activities of the University to enable it to achieve its purpose.
The University’s implemented consultant, JANA, provides strategic investment advice to the University and implements most of the investment strategy on behalf of the University through external investment managers. The University’s strategic investment decisions are implemented by JANA primarily via investment in pooled investment trusts. Therefore, the University does not make individual investment decisions on whether to buy or sell specific company holdings, nor does it undertake direct activity with respect to corporate actions.
JANA has a long history of successfully providing investment consulting and investment management services in Australia and integrates sustainability considerations into investment decisions.
Responsible investment metrics
Summary
For 2024, the University is reporting on the same responsible investment metrics as were first reported in 2022. This includes listed Australian Equities and International Equities, which together represent approximately half of the University’s investment portfolio and are the only asset classes for which reasonable data is available. It is important to note that robust and consistent data remains a challenge across the industry. The University also invests in other asset classes, including fixed interest, infrastructure, property, and private equity. Carbon emissions data for these asset classes will be included in future reports as methodologies and confidence in the data improves.
The University acknowledges that drawing definitive conclusions from carbon emissions data remains challenging, even as methodologies improve. While it may take several years to draw robust conclusions, and given the inherent complexity of these assessments, it is essential to remain engaged in this process and collaborate with like-minded investors to improve practices.
To better align with the reporting practices of the industry, the University has reported data for the 12-months to June 2024 rather than December 2024. The University is also assessing the impact of Australian Sustainability Reporting Standards (AASB S1 and AASB S2) on future reporting.
Metrics
The metrics reported for June 2024 align with prior years, though material data revisions have occurred due to evolving methodologies and improvements in reporting by companies and data providers. JANA, utilising external data providers, estimated the University’s financed emissions using the ‘Enterprise Value Including Cash’ (EVIC)[3] method. This approach measures the University’s share of a company’s emissions based on its proportionate investment in the company’s total value. This method aligns with the latest guidance from the Partnership for Carbon Accounting Financials (PCAF) and the recommendations from the Task Force on Climate-related Financial Disclosures (TCFD).
The EVIC method enables the University to actively monitor the financed carbon emissions of its investment portfolio, while also providing JANA with actionable data to engage investment managers on the emissions profile of their investments.
There are recognised limitations with estimating financed emissions and the EVIC method itself, including:
- Share price movements, which affect the attribution of emissions between equity and debt holders
- Data methodology updates, impacting consistency and comparability
- The adequacy of company disclosures, which influences data quality
- Historical emissions data, which does not account for forward-looking actions such as net-zero commitments and implementation plans
Key industry bodies, including those that the University and JANA are members of, continue to review these limitations, and advocate for enhanced methodologies used in calculating financed carbon emissions.
Estimated carbon emissions and carbon intensity of the University’s listed Equity investments[4]
Equities investments for year ended 30 June 2024 | UoM financed carbon emissions | Benchmark financed carbon emissions | UoM Weighted Carbon intensity | Benchmark Weighted Carbon intensity |
|---|---|---|---|---|
Measurement units | tCO2-e | tCO2-e | tCO2-e / US$m invested | tCO2-e / US$m invested |
Australian Equities | 82,052 | 76,031 | 72 | 67 |
International Equities | 29,867 | 42,578 | 26 | 37 |
Total (Australian and International Equities) | 111,919 | 118,609 | 49 | 51 |
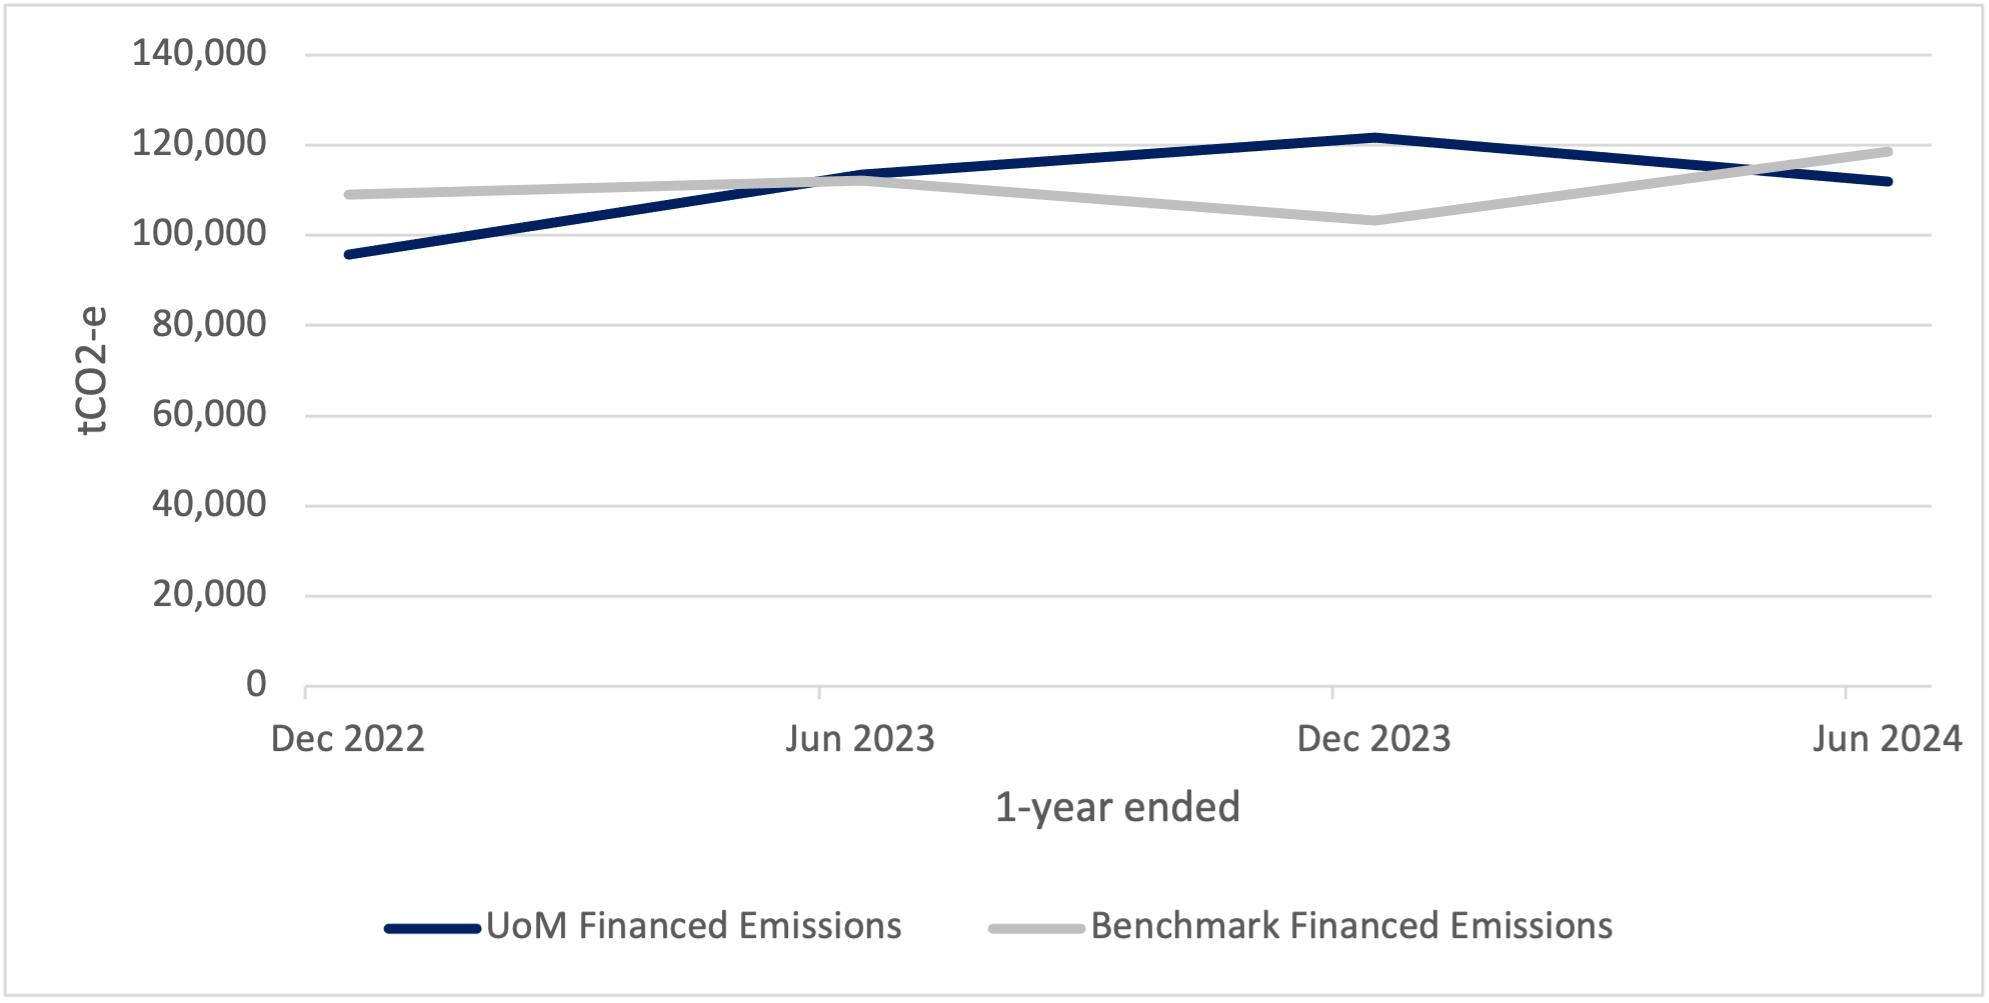
The University’s financed emissions for the year ended 30 June 2024 decreased by 8 per cent compared to the year ended 31 December 2023, driven largely by a 19 per cent reduction in financed emissions within the listed Australian Equities asset class. This decline primarily reflects underlying investment managers reducing their holdings in high-emitting assets. Overall, the University’s listed equities portfolio displayed slightly lower carbon intensity than its benchmark.
To ensure continued progress, the University will monitor the sustainability performance of the investment portfolio (noting the limitations mentioned earlier) by annually reviewing the carbon emissions and engaging with JANA on its activities and those of the underlying investment managers. We recognise the importance of medium-to-long-term trends rather than short-term fluctuations, particularly in the context of forward-looking, Paris-aligned commitments and variable source data.
Trend analysis must be complemented with qualitative, forward-looking evaluations for a comprehensive assessment. JANA, has developed a Net Zero Manager Assessment framework to evaluate investment managers’ net zero commitments, strategies, and the robustness of their actions. Insights from these assessments inform JANA’s engagement and stewardship initiatives, enhancing net zero ambition and implementation.
The following charts provide historical data on carbon emissions and carbon intensity for the assets reported by the University. Please note that these figures are best understood within the broader context of the University’s commitment to sustainability and the focus on longer term trends described above.
Estimated carbon emissions from listed equities over time
Estimated carbon intensity from listed equities over time

UoM Top 20 holdings by value as of 30 June 2024
| No. | Stock Name | Sector | % of total listed equities (based on $ invested) |
|---|---|---|---|
1 | BHP Group Limited | Materials | 3.7 |
2 | CSL Limited | Health Care | 3.4 |
3 | Microsoft Corporation | Information Technology | 2.3 |
4 | National Australia Bank Limited | Financials | 1.8 |
5 | Commonwealth Bank of Australia | Financials | 1.8 |
6 | Australia and New Zealand Banking Group Limited | Financials | 1.5 |
7 | Macquarie Group Limited | Financials | 1.4 |
8 | Santos Limited | Energy | 1.2 |
9 | Thermo Fisher Scientific Inc. | Health Care | 1.2 |
10 | Amazon.com, Inc. | Consumer Discretionary | 1.2 |
11 | Novo Nordisk | Health Care | 1.1 |
12 | Alphabet Inc | Communication Services | 1.1 |
13 | Taiwan Semiconductor Manufacturing | Information Technology | 1.1 |
14 | Incitec Pivot Limited | Materials | 1.0 |
15 | ASML Holding NV | Information Technology | 1.0 |
16 | QBE Insurance Group Ltd | Financials | 1.0 |
17 | Goodman Group | Real Estate | 0.9 |
18 | Visa Inc. | Financials | 0.9 |
19 | Orica Limited | Materials | 0.9 |
20 | Westpac Banking Corporation | Financials | 0.9 |
Top 20 | 29.4 | ||
The top 20 holdings by size comprise approximately 29 per cent of the total listed equities asset classes (Australian and International Equities) and contribute approximately 25 per cent of the University's absolute financed emissions.
Listed equity investment sector exposures and estimated carbon emissions
| Sector | % of total listed equities ($ invested) | Estimated UoM carbon exposure (tCO₂e) |
|---|---|---|
Financials | 20.9 | 494 |
Materials | 13.5 | 64,215 |
Information Technology | 13.1 | 2,012 |
Healthcare | 12.2 | 907 |
Consumer Discretionary | 9.3 | 1,232 |
Industrials | 9.3 | 6,894 |
Consumer Staples | 5.4 | 2,523 |
Communication Services | 5.0 | 588 |
Energy | 4.2 | 14,496 |
Real Estate | 3.1 | 617 |
Utilities | 1.1 | 17,940 |
Reporting from JANA shows that the University’s holdings are distributed across a wide range of sectors. Some of these sectors are traditionally relatively low carbon emitters, for example the financials, health care and IT sectors. Others, such as the materials, energy and utilities sectors, are more carbon intensive. These are also sectors that are important to the energy transition and decarbonisation solutions.
Additional governance information
The University’s Responsible Investment Guide (RIG) was released in 2024. The RIG was developed in collaboration with the University’s implemented consultant and in consultation with Melbourne Climate Futures.
The University became a signatory to the Principles for Responsible Investment (PRI) in 2020 and reports its responsible investment activities regularly to the PRI.
The University became a member of the Investor Group on Climate Change (IGCC) in 2022.
The University’s Investment Management Committee participated in formal education sessions on sustainability-related topics as part of its ongoing learning.
Green bond
The University’s Green Bond, issued in 2022 under our Sustainability Financing Framework, is being audited by DNV Business Assurance Pty Ltd for the period ended 31 December 2024 to provide assurance that the University’s Green Bond instrument meets the criteria established in the Eligibility Assessment Protocol and is aligned with Green Bond Principles 2021.
FOOTNOTES
[1] This will include investments in the University’s Investment Portfolio for which the carbon footprint can reasonably measured or estimated.
[2] United Nations Principles for Responsible Investment (UNPRI)
[3] Financed emissions are measured using ‘Enterprise Value Including Cash’ (EVIC) allowing measurement of an investor’s share of emissions proportional to its exposure to the investee’s total value. EVIC is defined as the sum of the market capitalisation of ordinary shares and preferred shares at fiscal year-end, and the book values of total debt and minorities’ interests. No deductions of cash or cash equivalents are made to avoid the possibility of negative enterprise values.
[4] Notes:
- The emissions data is limited to what is reported by the underlying companies and what is estimated by JANA’s data providers (Sustainalytics and FactSet) and covers Scope 1 and Scope 2 emissions only.
- The benchmark for the listed Australian Equities asset class is the S&P/ASX 300 Index and the MSCI All Country World Index for the listed International Equities asset class. The benchmark for total equities is a blend of the Australian and International Equities benchmark, based on the University’s invested weights of the two asset classes. The benchmark financed emissions figures assume an investment equivalent $ amount in the index.
- Carbon emissions are in metric tonnes of CO2 equivalent (tCO2e).
Our sustainability strategy
At the University of Melbourne, our efforts in sustainability are guided by Sustainability Plan 2030 - a roadmap for sustainable delivery of our institutional strategy Advancing Melbourne.
Read more about how we are advancing sustainability at the University:
