2025 Sustainability Report
Climate leadership
Domain: Amplifying action through campus and communities
Aspiration to 2030: Through demonstration of its operations, the University has catalysed ambitious climate action by others.


Progress against targets
| Target | Target status | Progress in 2025 |
|---|---|---|
| The University is certified carbon neutral by 2025.[4] |
| |
| The University has achieved climate positive status by 2030. | Not yet started |
|
Our progress
Greenhouse gas emissions
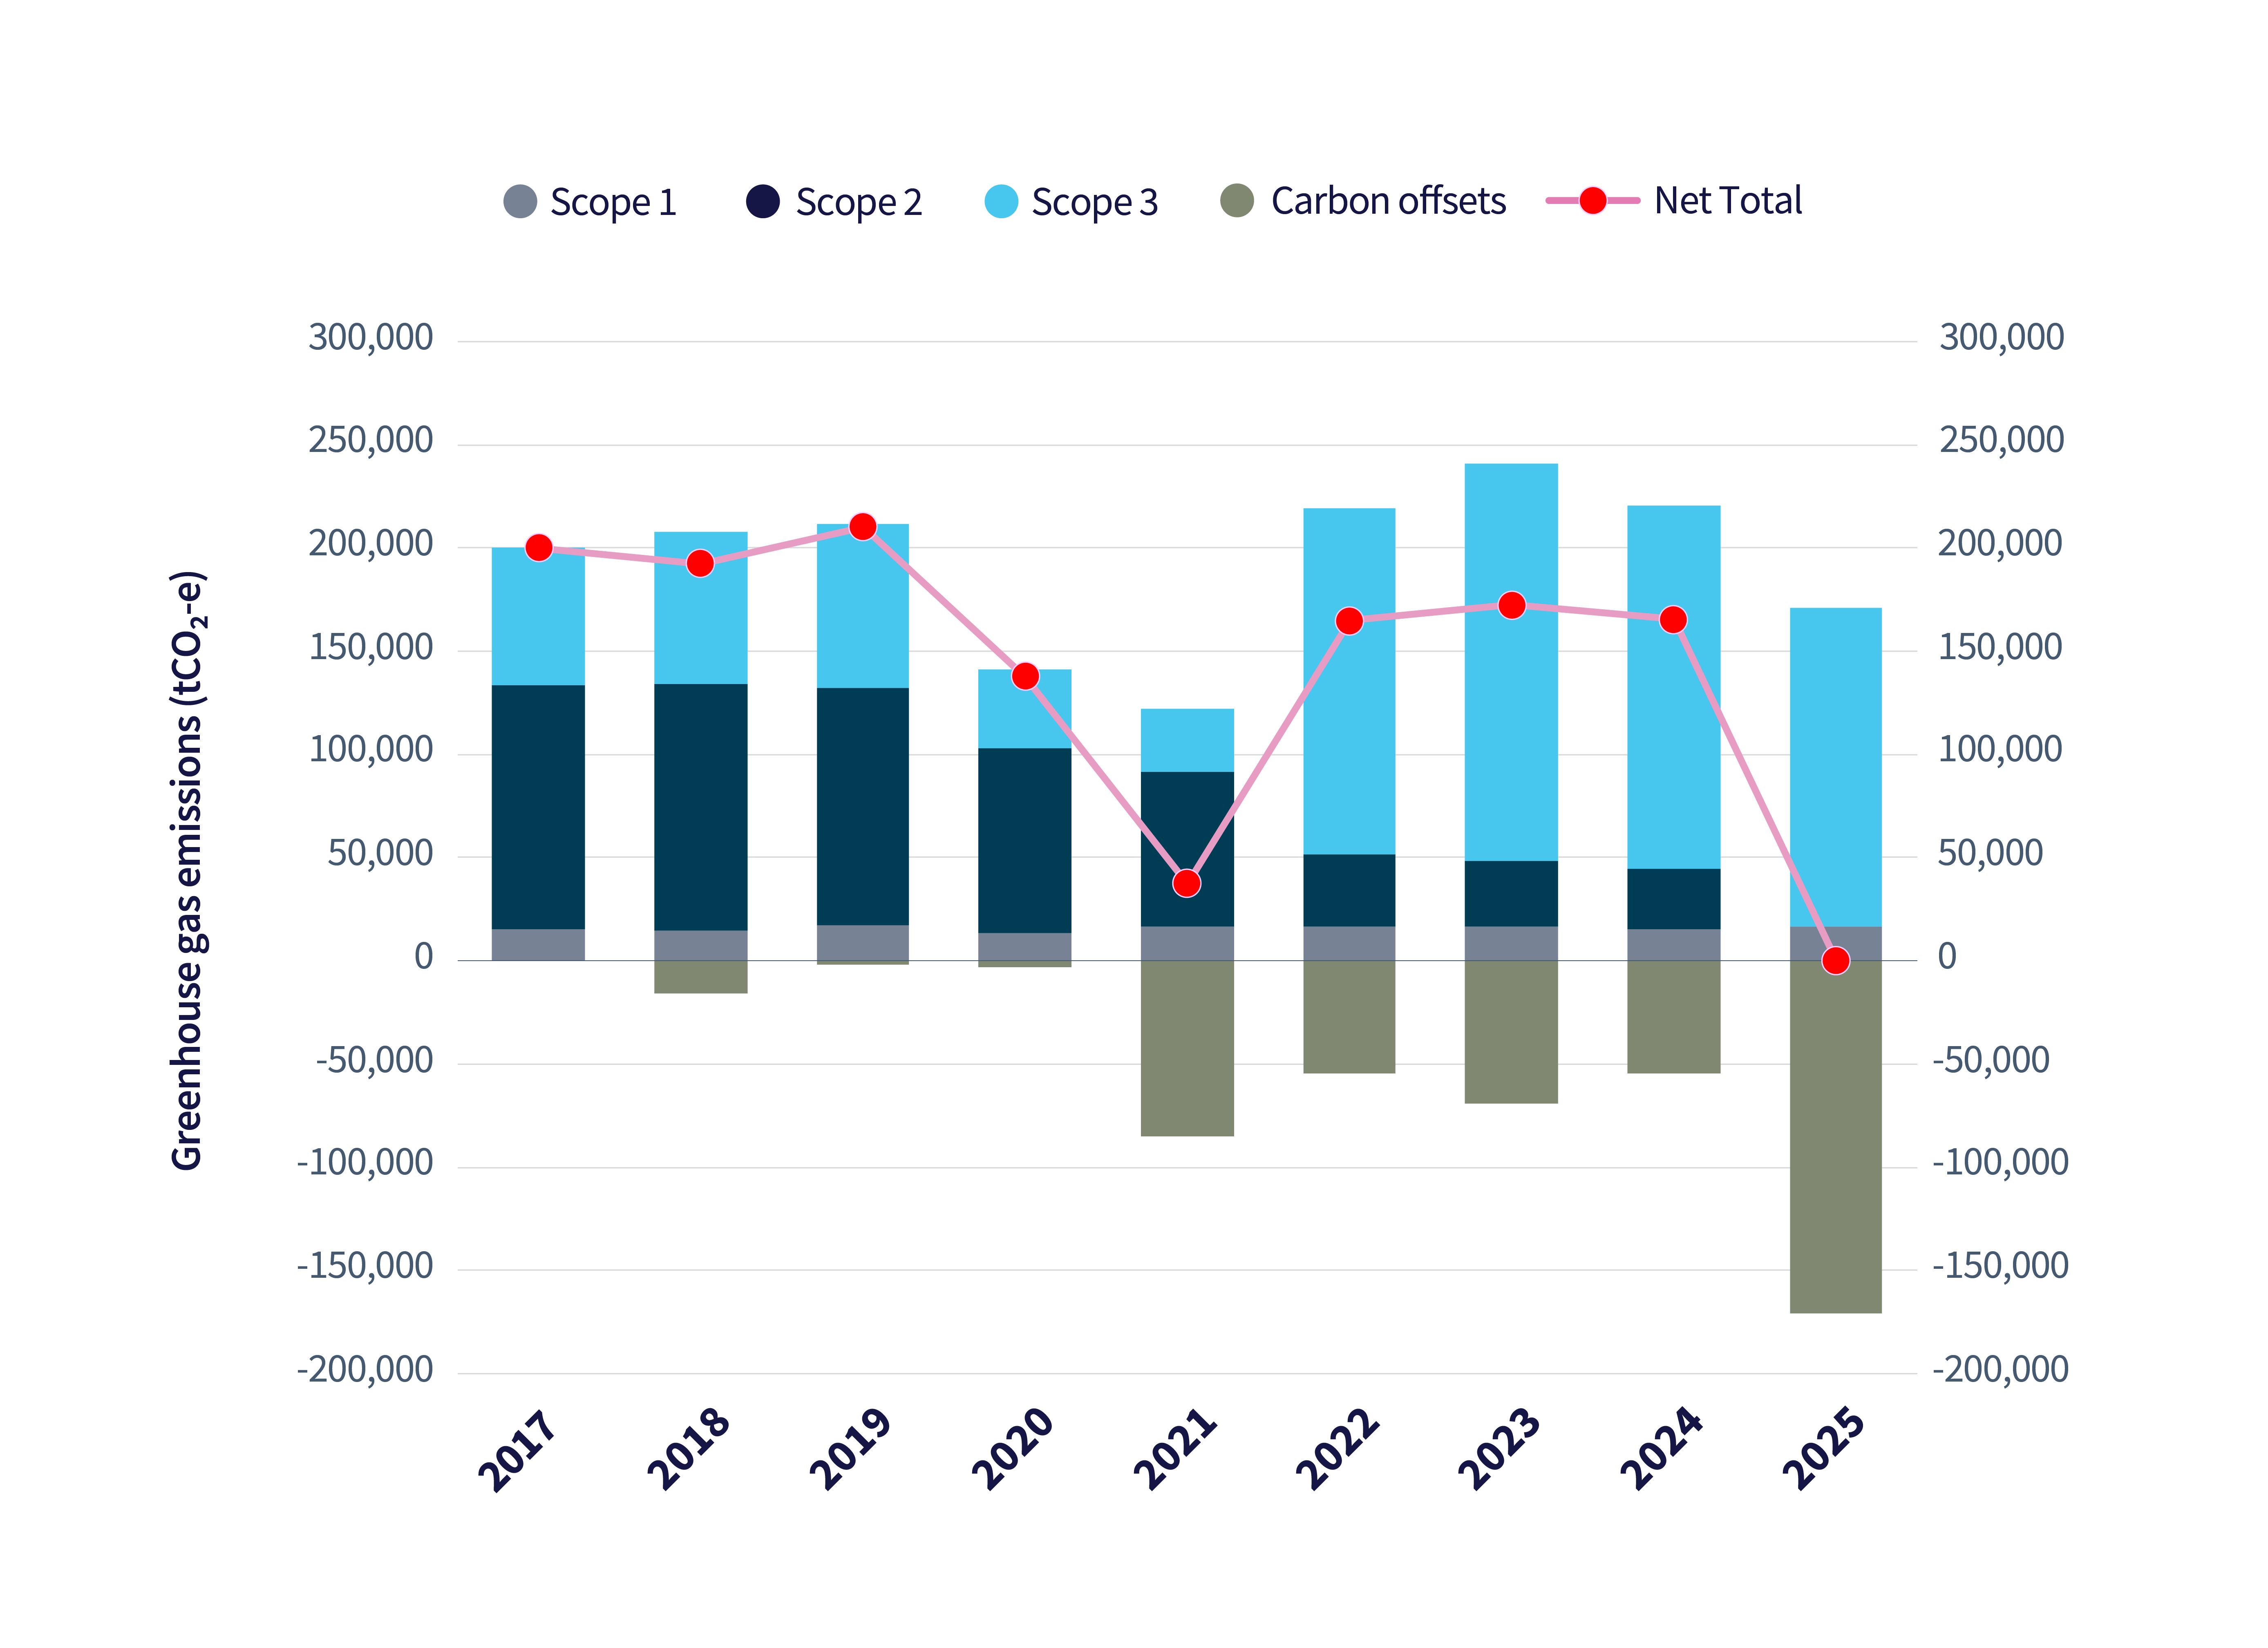
The University’s total gross emissions for its 2025 greenhouse gas (GHG) inventory were 170,705 tonnes of carbon dioxide equivalent (tCO2e). This signifies an approximate reduction of 22 per cent from the University’s 2024 total gross emissions of 220,239 tCO2e.The largest contributor to this annual reduction is due to the University procuring 100 per cent renewable electricity, which avoided approximately 90,400 tCO2e from being emitted. Emissions from purchased goods and services and capital goods also decreased due to lower annual expenditure, while decreases in annual spend-based emission calculation factors and analyses of spend data also resulted in more granular emission factors being applied. Flight emissions also decreased due to staff travelling less for business purposes in 2025.
While the University’s 2025 GHG inventory was lower overall, there were several notable increases. The University conducted a review of facilities within its boundary in 2025 to both ensure mandatory National Greenhouse and Energy Reporting and voluntary GHG reporting boundaries were aligned, and to identify if any facilities were missing. While the Scope 2 boundary was found to be complete, several facilities were identified that fell within Scope 3 upstream leased assets, downstream leased assets and subsidiaries where the University does not have operational control (investments). These facilities included leased space in a data centre, clinical sites external to the University, as well as emissions from Melbourne Business School buildings. These have now been brought within the University’s organisational boundary and will be reported and verified annually moving forward. The University continues to review its emissions boundary on an ongoing basis.
The University has achieved carbon neutral certification for its CY2025 Australian business operations under the Australian government's Climate Active program. Achieving this certification reflects the University's sustained commitment to reducing emissions at source, alongside a measured approach to addressing residual emissions through high-quality carbon offsets, procured in line with its Carbon Offset Procurement Framework and the relevant Climate Active standards and guidance.
Offset investments were allocated across a range of project types, including Indigenous-led savannah burning, revegetation, agricultural practices, and waste management activities. Refer to the University's Public Disclosure Statement on Climate Active.
In 2025, the University achieved 100 per cent renewable energy for electricity (Scope 2), up from 70 per cent in 2024. This achievement is based on two long-term power purchase agreements, onsite solar generation and renewable energy certificates. Read more about this achievement under Our Impact.
Greenhouse gas emissions | 2017-2025
Staff commuting and working from home
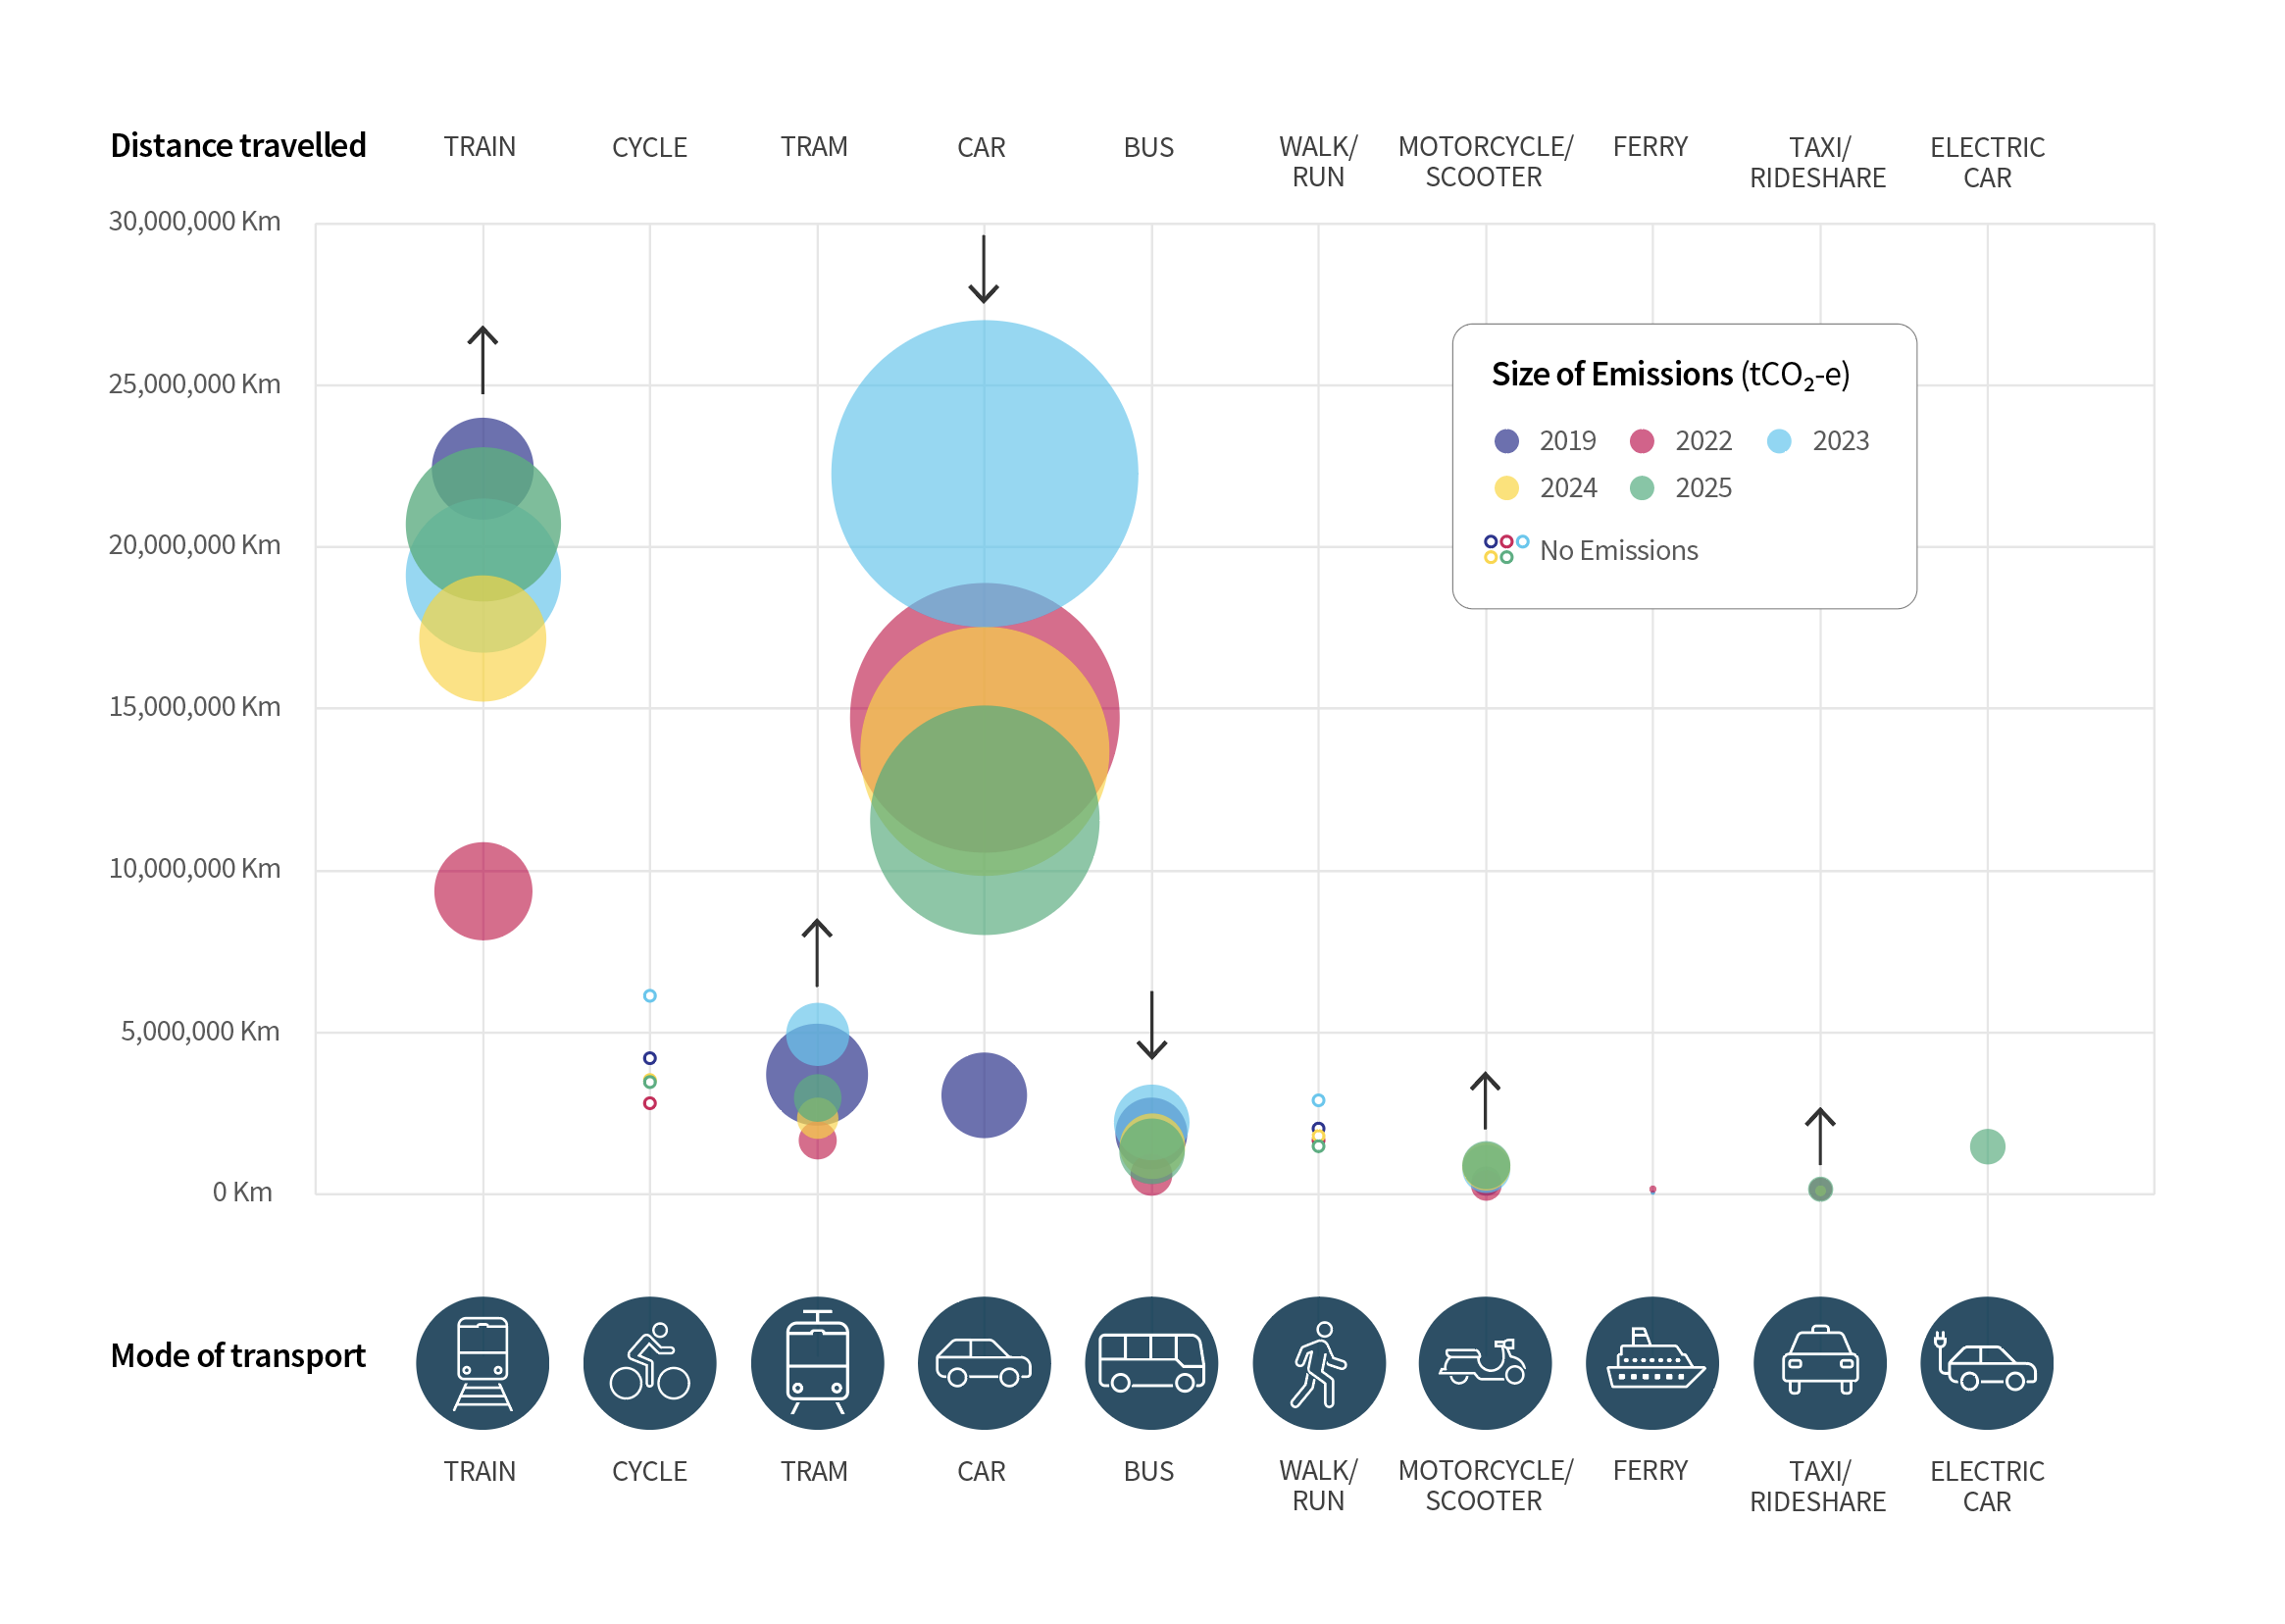
Emissions from staff commuting decreased by 6 per cent between 2024 and 2025. The University’s annual staff commuting survey indicated that staff travelled less via petrol and diesel private vehicles, and increased travel via public transport (train and tram) and lower emitting private vehicles (electric and hybrid cars). Annual variations in the number of respondents and their specific travel patterns between 2024 and 2025 is also likely to have contributed to differences in annual staff commuting patterns.
Emissions from staff working from home remained steady between 2024 and 2025, increasing by 1 per cent (approximately 24 tCO2e). Results from both the 2024 and 2025 staff commuting surveys indicated that, university employees work from home on average 32 per cent of the time.
Staff commuting patterns | 2019-2025
Click here to see data table of dataset used above
Air travel emissions
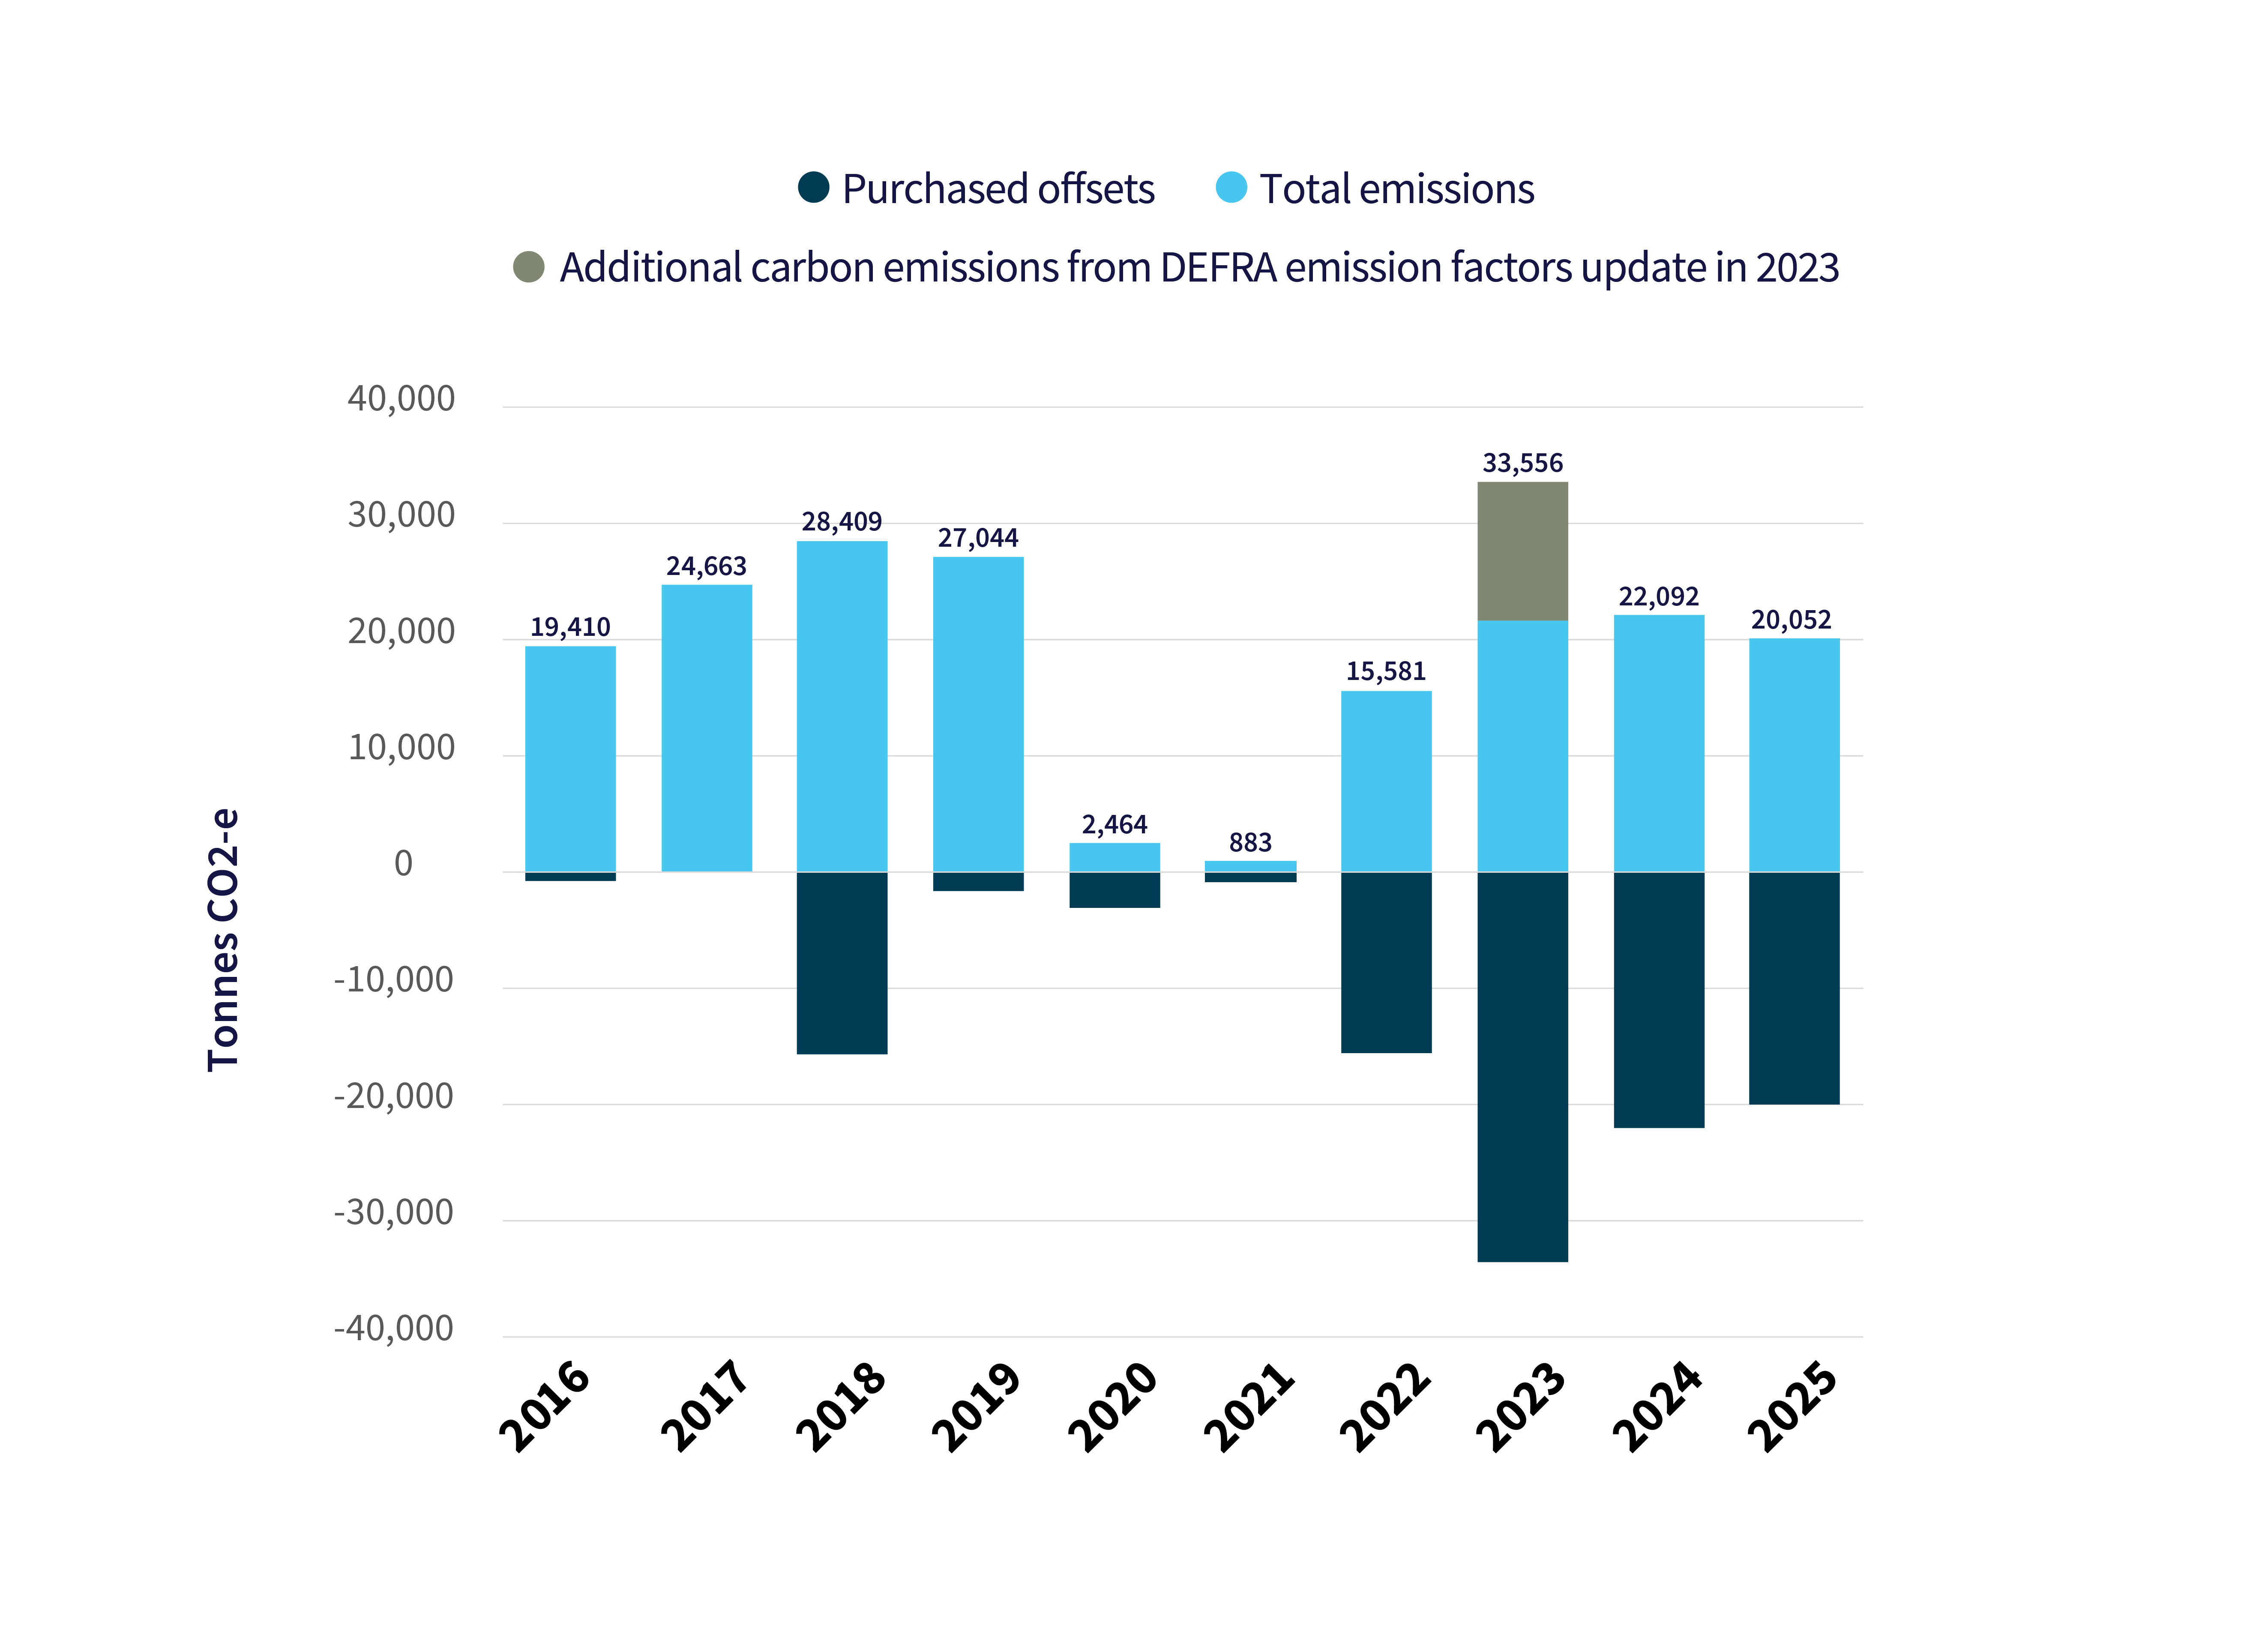
The University met its goal of reducing flight emissions by 10 per cent. Total GHG emissions in 2025 from flights were estimated to be 20,052 tCO2e, 26 per cent below the 2019 baseline. Air travel kilometres reduced by 13 per cent over the same period. This achievement is attributable in part to the University’s Air Travel Emissions Reduction Program, reduced travel budgets and improvements within the aviation industry such as newer fuel-efficient aircraft being integrated into fleets and lower carbon fuels being used.
Staff air travel emissions | 2016-2025
Click here to see data table of dataset used above
Note: In 2024, the University transitioned from using DEFRA emission factors to calculating staff air travel emissions through Thrust Carbon, an ISO 14083-certified platform. In 2025, the two methodologies were assessed and found to produce comparable results.
Energy consumption and generation
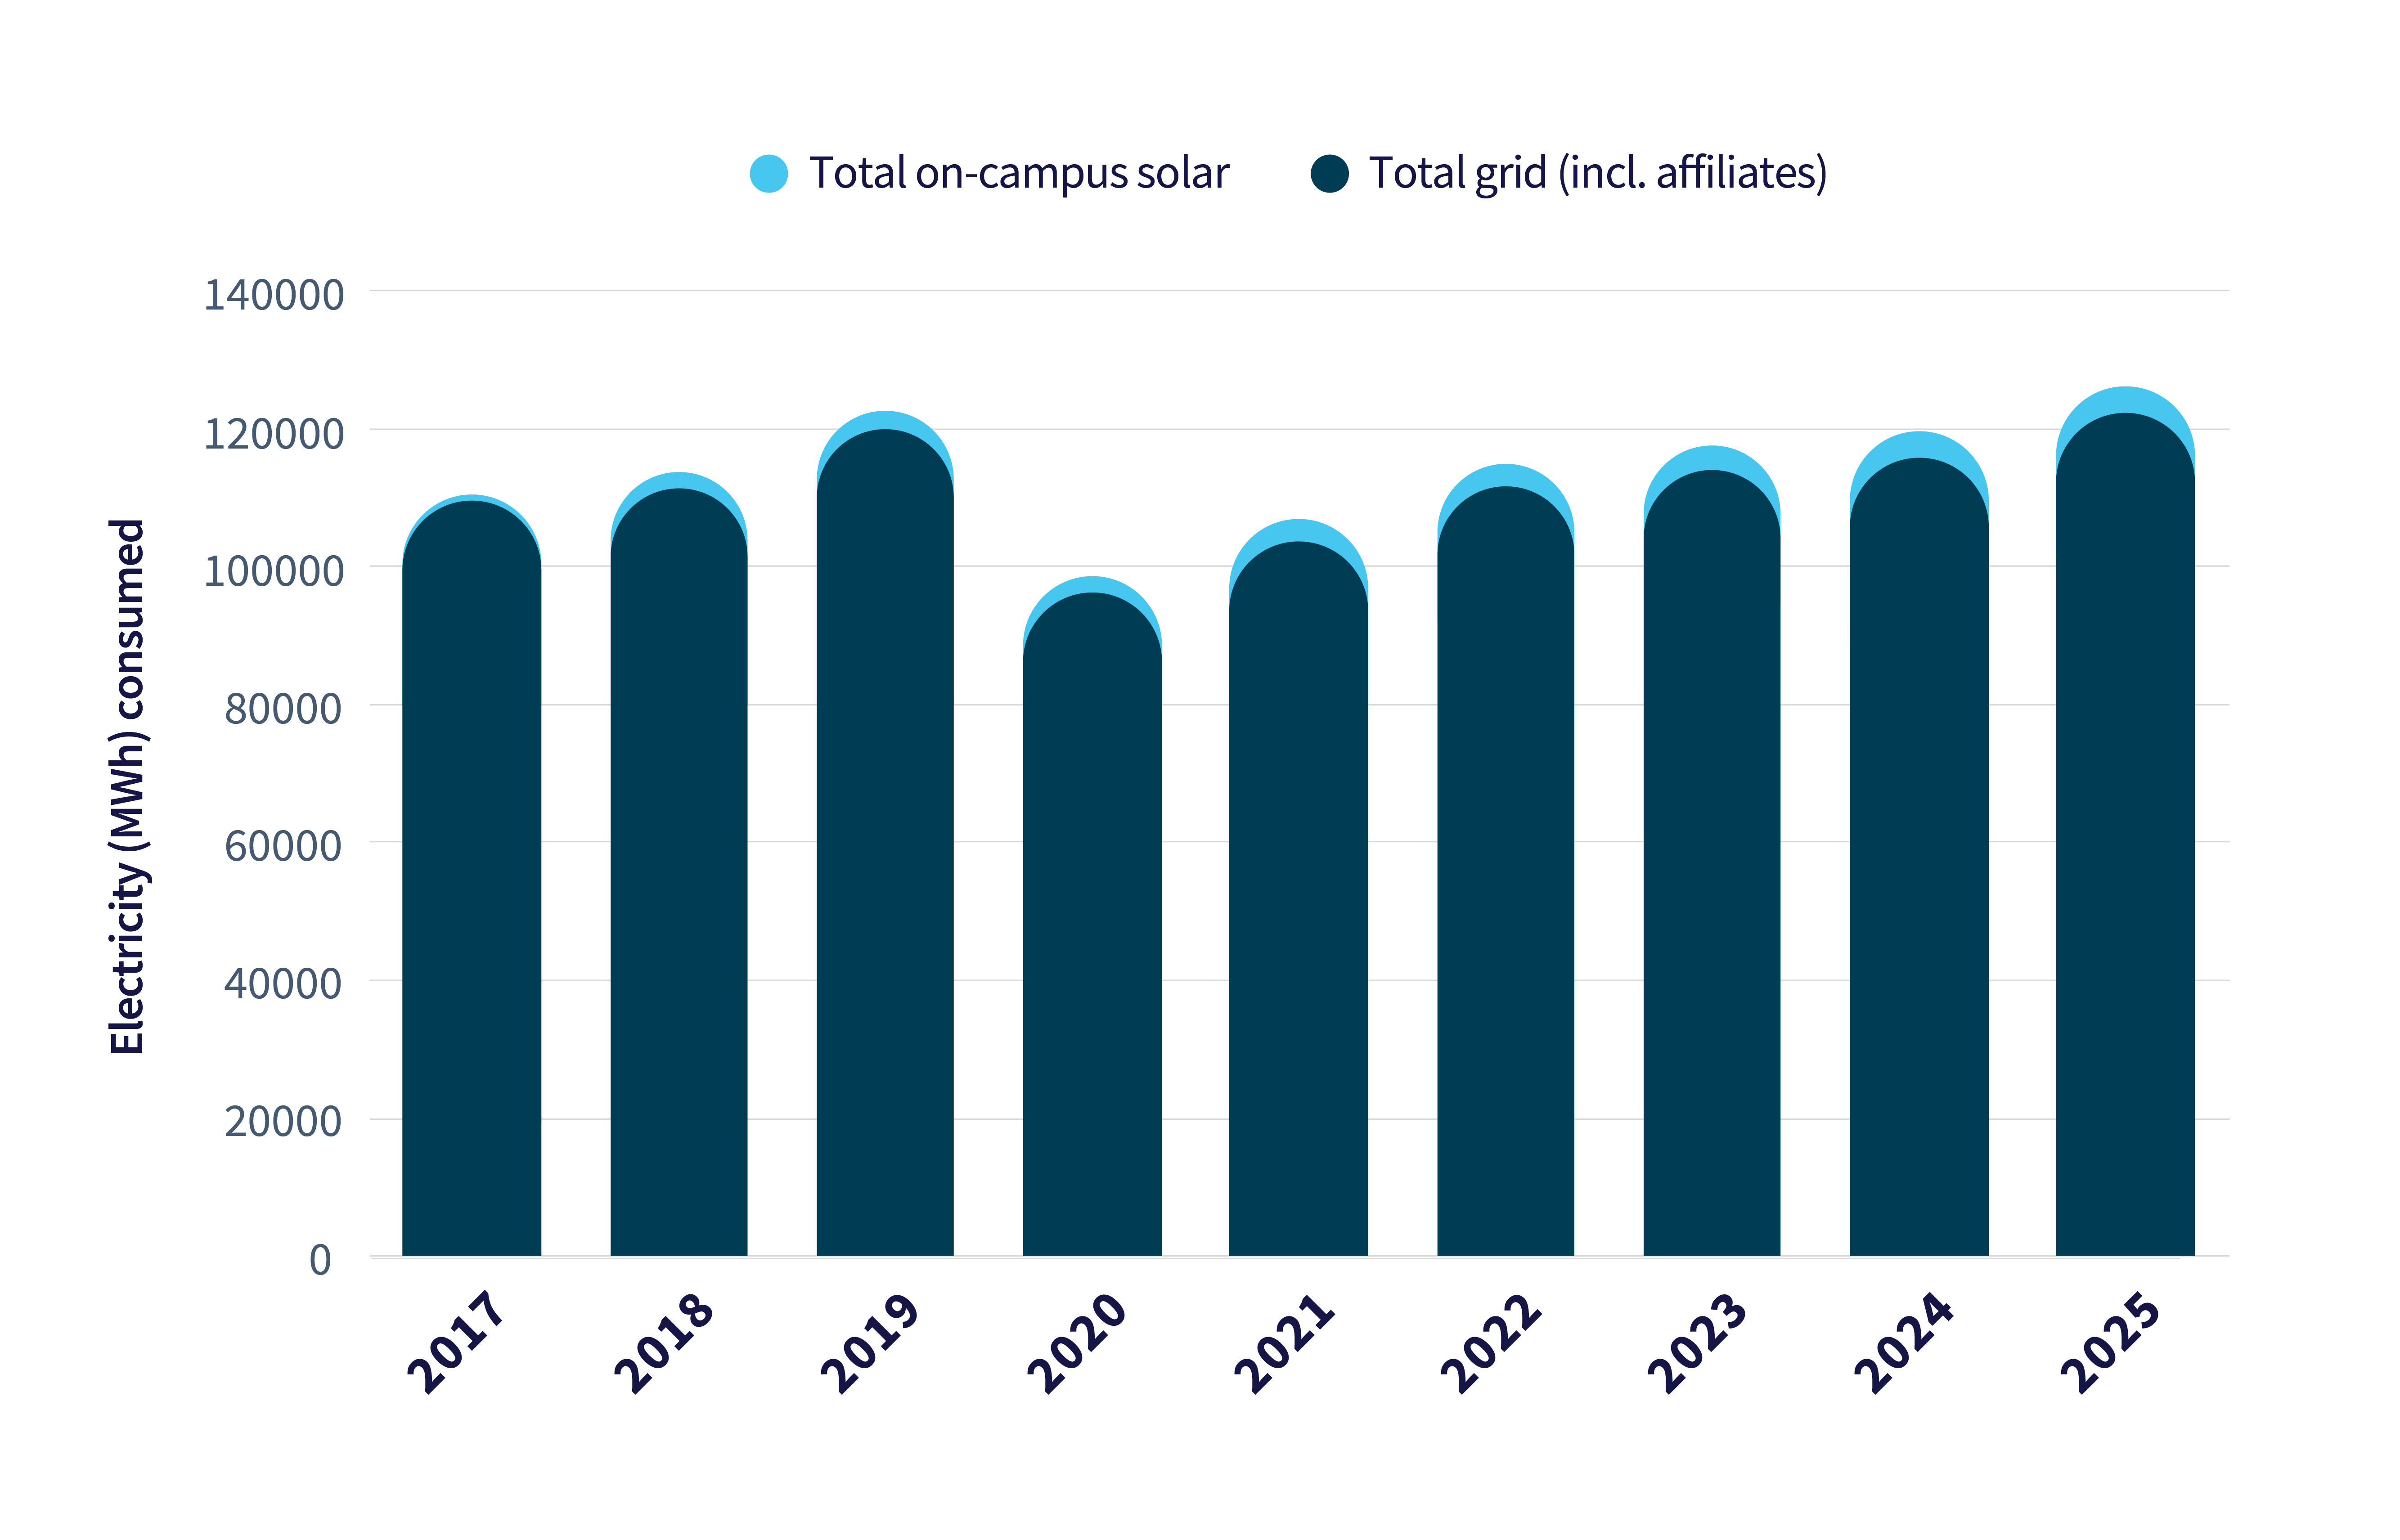
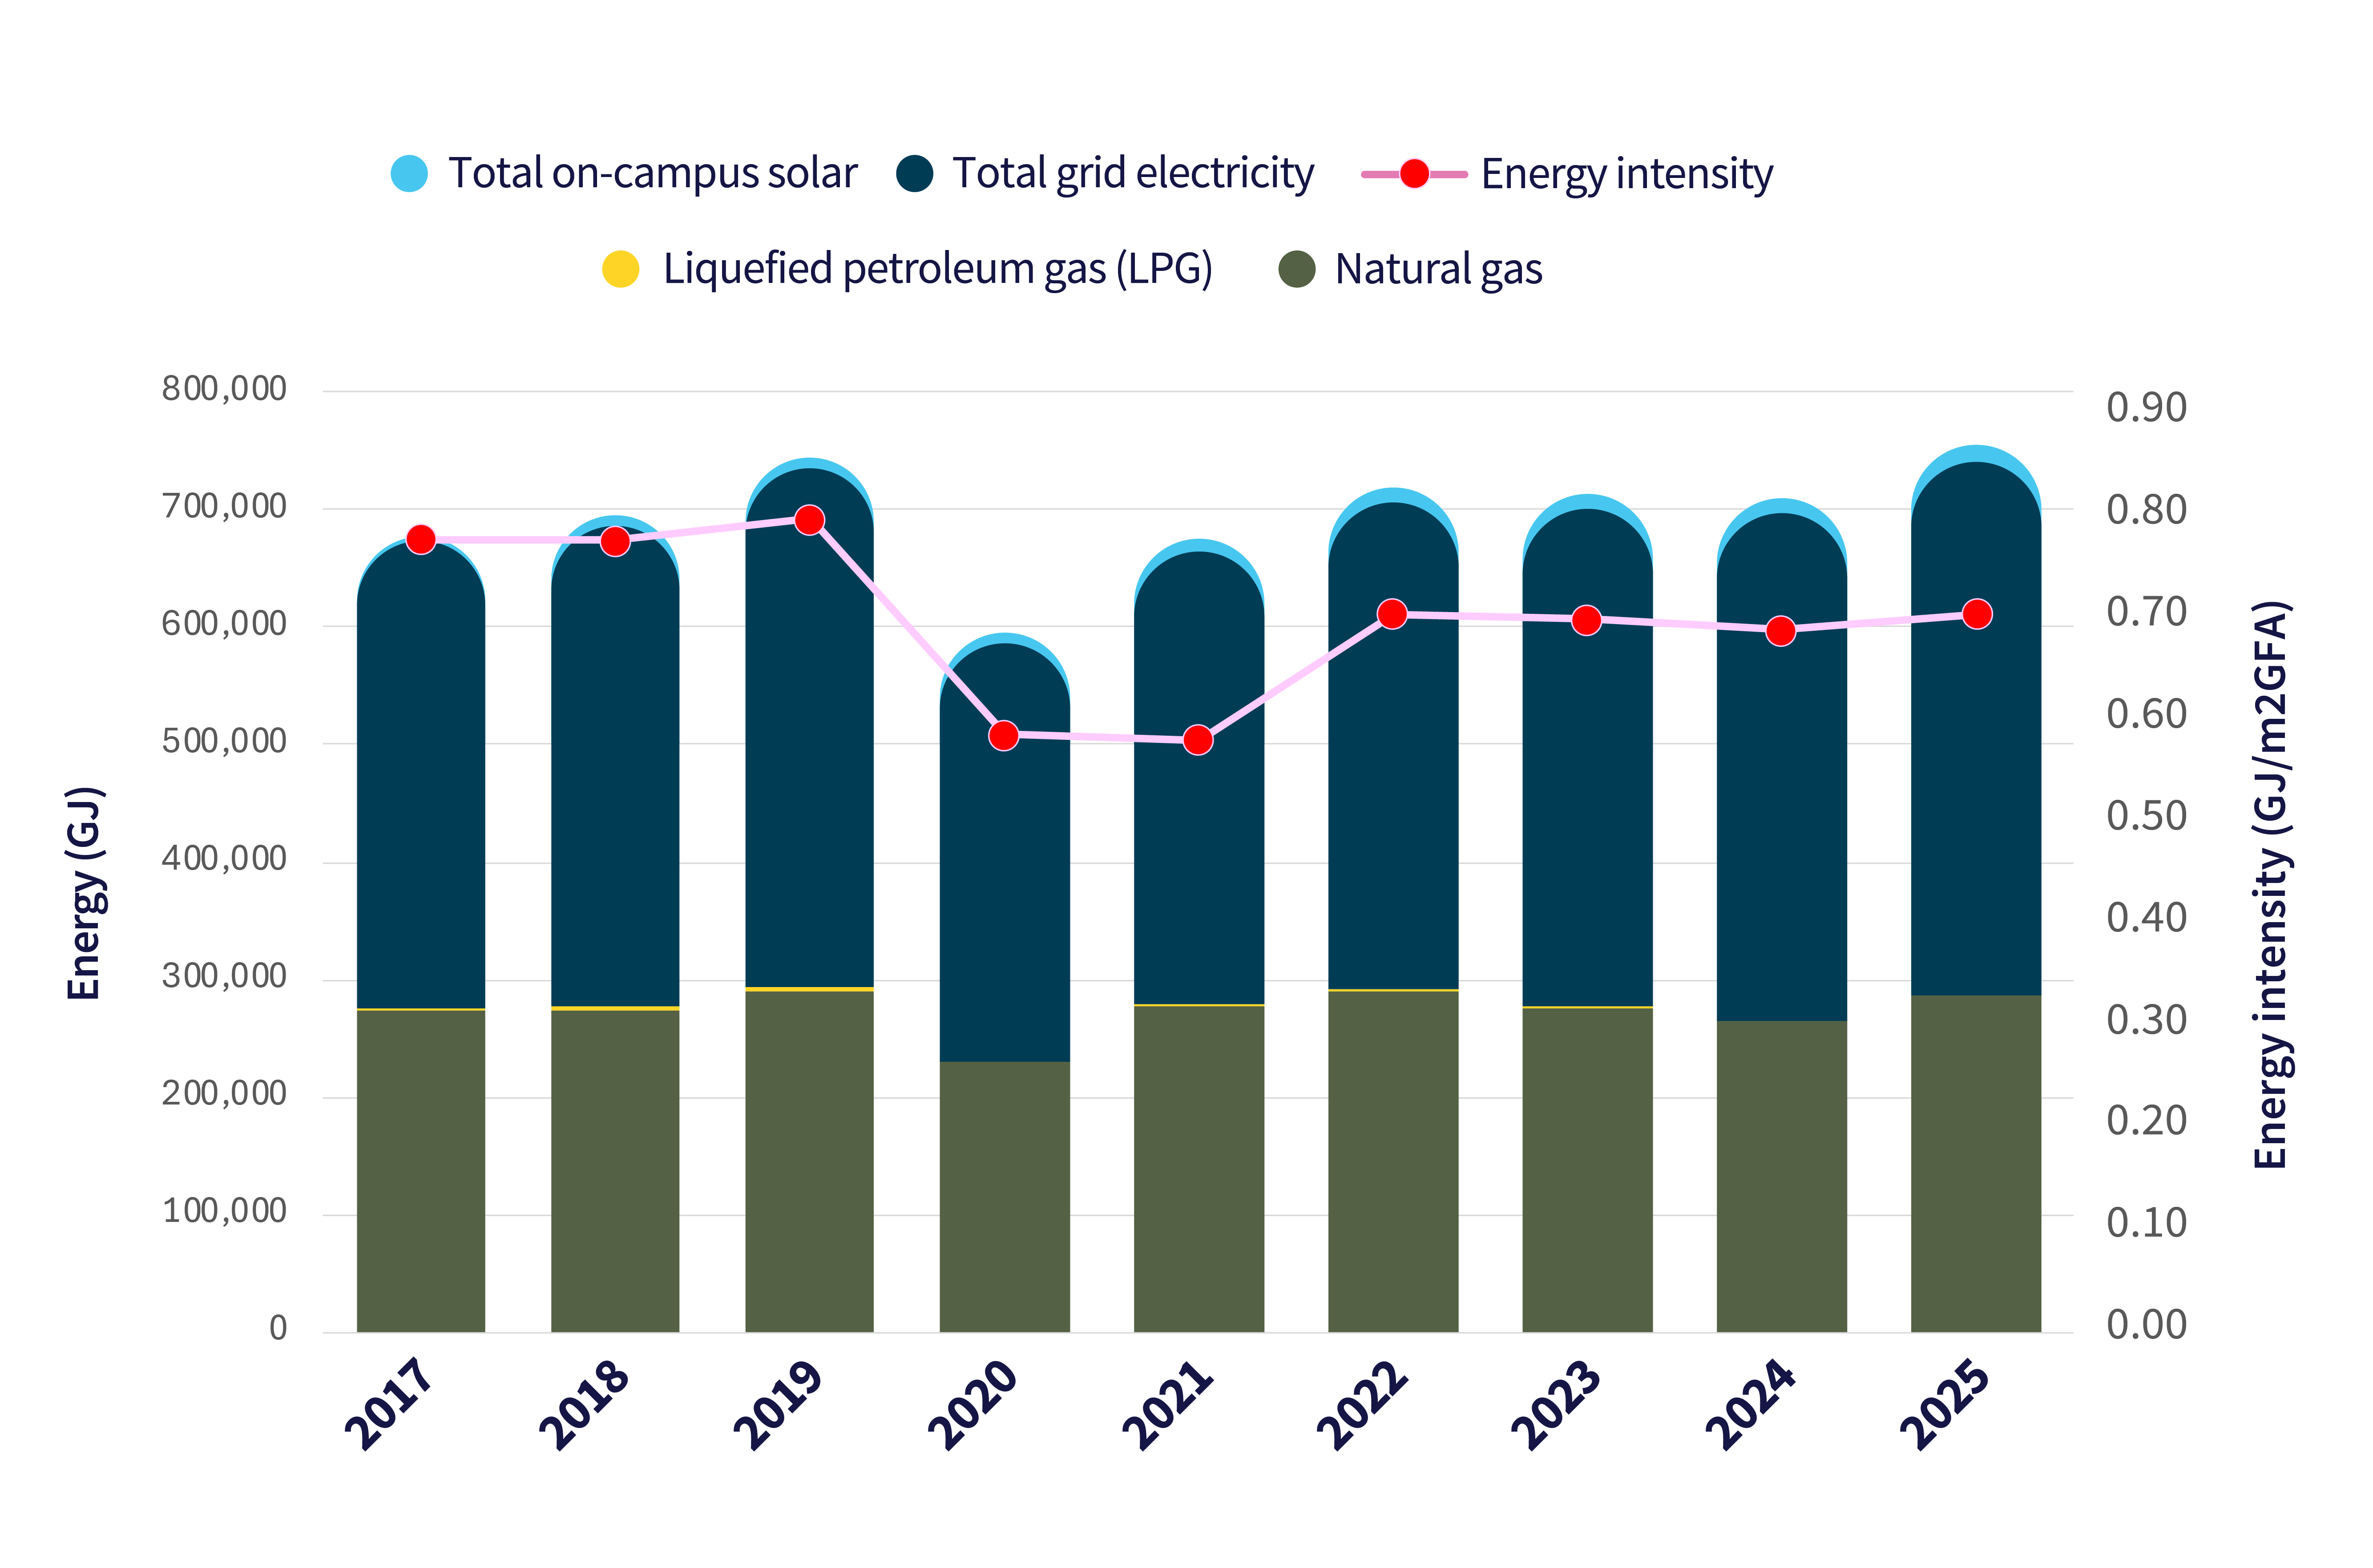
The University's 2025 energy demand remained steady compared with 2024 levels. Electricity consumption increased by less than one per cent, while natural gas consumption increased by one per cent. The University's energy intensity, measured by usage per square metre, increased by approximately one per cent.
On-campus solar generation increased by approximately two per cent to 3,863 MWh due to the addition of solar panels at the Dookie campus's vineyard and new student accommodation, and the commissioning of one of Southbank's solar photovoltaic systems. The purchase of electricity generated by wind farms under the University's power purchase agreements was 63,169 MWh (CY2024: 73,797 MWh).
Total electricity usage | 2017-2025
Click here to see data table of dataset used above
Total energy consumption by source | 2017-2025
Click here to see data table of dataset used above
Our stories
Embedding climate leadership in procurement
Supply chain GHG emissions are hard to abate due to data quality challenges and the capacity and influence the University has to support its suppliers in decarbonising. For the University, supply chain GHG emissions are important as they are the largest source of operational GHG emissions. Supply chain emissions are estimated to make up approximately 67 per cent of the University’s total operational GHG emissions. As a result, the reduction of supply chain emissions is one of the most important actions that the University can take to address climate change and lead by example.
Since 2024, the University’s Procurement and Sustainability teams have worked together to develop and embed knowledge, processes and tools into the procurement function to support the attainment of two key outcomes: (1) to collect actual GHG data from suppliers relevant to the university’s procured goods and services; and (2) to support and encourage suppliers to decarbonise their own GHG emissions. This has included setting up tools to identify suppliers who contribute to most to the University’s GHG emissions, developing GHG clauses that can be embedded into key contracts requiring key suppliers to provide GHG data and commit to reducing their own emissions, as well as upskilling supplier staff.
The University has also sought to partner with its suppliers on this journey. In 2024, the University held its inaugural Sustainable Supplier Symposium, which provided a forum for discussion on achieving the University’s Climate Leadership targets and uplifting supplier capabilities to measure and reduce their own GHG emissions.
Footnotes
[4] Climate Active business operations carbon neutral certification. For more information refer to https://www.climateactive.org.au/
Our sustainability strategy
At the University of Melbourne, our efforts in sustainability are guided by Sustainability Plan 2030 - a roadmap for sustainable delivery of the University's Strategy 2030: Resilience.
Read more about how we are advancing sustainability at the University:
