Data-informed teaching
What are learning analytics?
Learning analytics describe the measurement, collection, analysis and reporting of data about learners and their contexts, for purposes of understanding and optimising learning and the environments in which it occurs. (Long et al., 2011).
Quick links
When you need to access data from your student’s learning environment/LMS, it can be challenging to know where to begin. Much like in modern life, we often have access to a large amount of data, so the question then becomes ‘what data is useful?’ and ‘what am I going to do with the information I glean from it?’
In this post we’ll give an overview of an introductory framework to using learning analytics in a scholarly manner, and we’ll provide a list of resources for where to find the data.
Framework for a scholarly approach to learning analytics
The diagram below shows the four stages of engaging with learning analytics to improve student outcomes, being questions, data, interpretation, and responses.

This framework diagram was developed by Dr Paula De Barba (formerly CSHE) and Bronwyn Disseldorp (formerly Learning Environments), based on themes from Wise, A. F., & Jung, Y. (2019) and Li, Jung and Wise (2021)
Step 1: Creating useful questions
A good place to begin before looking for data is to consider what questions you have about your subject. Maybe you have a specific goal or target in mind, or a problem you are trying to solve, or perhaps you’d like to evaluate your teaching practice or learning design.
Li, Jung and Wise (2021) found that the questions instructors are seeking data for can be categorised into three themes:
- Goal-oriented: instructor has a particular subject goal and wants to see if it is being met.
- Are students following my suggestions? (I announced some useful resources in the lecturer, are students accessing these?)
- Problem-oriented: instructor wants improved understanding of a problem they see in their subject.
- Why are so few students using the discussion board?
- Are low levels of interaction with materials related to low performance?
- Modifying instruction: instructor would like some insight into an aspect of their subject they would like to modify.
- What time is the best time to send announcements?
- Which topic should I most focus on in the review lecture based on the quiz?
What are the questions you have about your subject?
Student engagement and understanding:
- Are students struggling with a particular topic?
- To what degree are students engaging with recorded lecture material?
- Are students engaging with pre- and post-class activities?
Learning design and evaluation:
- Is my subject’s learning design working as planned? (for example, flipped classroom)
- How effective is a new intervention/innovation I implemented?
Participation and access metrics:
- What materials are being accessed more frequently?
- Which weeks have high numbers of page views in the subject?
- What are the most visited pages or resources in your subject - apart from the home page?
- Which activity has the highestparticipation?
Engagement trends over time:
- At what point is there a drop-off in engagement?
- How is student engagement evolving over the subject duration?
What aspects of your subject are you curious about?
Sometimes you might find you don’t have a specific question initially, and that is OK. Embracing a ‘spirit of curiosity’ is a great place to start. Exploring what data is available will help questions come to mind, and will also further refine your existing questions.
For further ideas see Li, Q., Jung, Y., & Wise, A. F. (2021). Beyond First Encounters with Analytics: Questions, Techniques and Challenges in Instructors’ Sensemaking. LAK21.
Step 2: Gathering the data
What data sources will best provide answers to your questions?
Data from systems
As you delve deeper into your subject, you will find numerous data sources available. In addition to the Canvas LMS, most of theoffer valuable data. Any piece of information related to learning and teaching processes has the potential to support insight. This includes not only online interactions, but also face to face engagements, activities outside the LMS, feedback from students and tutors.
For a comprehensive list of data sources specific to your subject and related tools, refer to the end of this article: 'Where to find data in your subject'.
Step 3: Interpretation (sensemaking)
Once you have meaningful questions and have gathered the relevant data; the next step is to critically engage with the data, and really question it.
Reflect on your data’s origin and evolution
How did the origins, management and transformation processes influence the integrity and relevance of your data?
- How was your data created? Consider the instruments used, the purpose behind its creation, and by whom it was generated,
- How was your data managed? Understand the selection criteria, what information was prioritised, included or excluded.
- Was the data potentially transformed? Determine if the data was combined, related or restructured in any way.
(Wise, 2020, p. 166)
Example in practice
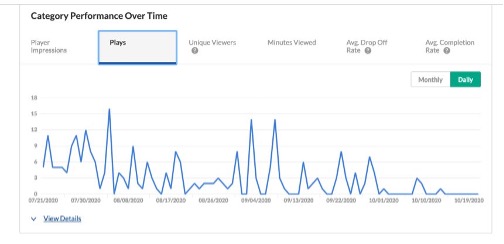
Figure 2 below is an example from Kaltura, a video management platform. In the screenshot from the video analytics, you could ask:
- What is the difference between ‘player impressions’ and ‘plays’?’
- How do ‘average drop-off rate’ and ‘completion rate’ compare?
- If a student pauses midway and then returns to finish it, how is this captured in the data?
To answer these sorts of questions, looking up a relevant tool guide can be helpful (or Googling).
Making sense of the data – using points of reference
How do historical trends, benchmarks, and feedback align with your data to highlight strengths and areas for enhancement in your teaching?
Exploring data in isolation can potentially lead to misconceptions or incomplete interpretations.
Establishing a point of reference provides a foundational context, aiding in drawing more informed and accurate conclusions from the data.
Reference points can include:
Historical data
Compare current data with previous semesters or years. Has there been significant growth or decline in certain areas? What has changed over time?
Benchmarking
Set specific standards or benchmarks for your course or subject. How does the current data measure up against these standards?
Peer comparison
Evaluate the performance or engagement of your subject in comparison to similar subjects or courses. Are there notable differences or similarities? (for example, comparing student lower engagement levels, comparing different student cohorts (part-time, full time etc) )
Student feedback
Use qualitative feedback from students as a reference. Does the data align with students' experiences and perceptions?
Learning design Intent
Reflect on the original goals and design of your subject. Is the data suggesting that students are engaging and learning as intended? (for example, looking for actions around specific tasks or activities in your learning design. Has a student accessed/engaged with the necessary learning task, logged in to LMS site, accessed specific resource?)
Developing data expectations
what answers do you think the data will provide, what hypotheses do you have, do the results match what you thought?
Collaborate
Consider having opportunities for ‘collaborative interpretation’ with your colleagues.
(Li, Jung and Wise (2021); Lockyer, Heathcote and Dawson (2013) )
By establishing these points of reference, educators can gain a more holistic view of their data, ensuring that their interpretations are grounded in a broader educational context and pedagogy. This approach not only assists in making sense of the data but also in identifying areas of improvement and innovation.
Step 4a: Responses
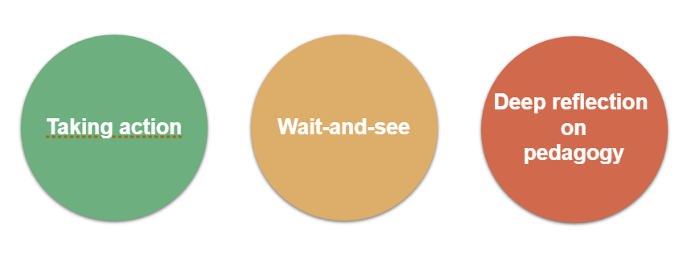
Learning analytics are truly only useful if action is taken. After you have retrieved relevant data, the question as to what to do with this information arises. It is common for teaching staff to struggle with how to turn the information they have found into relevant actions (Li, Jung and Wise, 2021).
Take action
- ‘Whole class scaffolding’ (for example, taking extra time to explain a concept if the data suggests many don’t understand a concept)
- ‘Targeted scaffolding (for example, some student less active/successful might receive an email or a meeting)’
- Revising your subject design.
Wait and see
- Let's see what happens? (maybe you’ve noticed a pattern, but don’t want to act until you’ve have more information).
Reflect
- Something within the data might cause you to reflect, have deeper inquiry, and be a catalyst for professional growth.
(Wise and Jung, 2019, pp. 62-63)
Ways to find inspiration for your interventions:
- Academic journals in your discipline
- Conferences
- Newsletters
- Chats with colleagues
- Chat with local or central learning designers.
Step 4b: Evaluation
The final step is to consider how you will evaluate if you’re the action you have taken based on learning analytics has been effective.
Learning analytics special interest group
In previous learning analytics workshops (pre-COVID) there was an interest from teaching staff in opportunities to informally share with others about learning analytics.
If you would be interested in joining future opportunities to share your learning analytics journey with other staff, please add your name to the list.
References
- Li, Q., Jung, Y., & Wise, A. F. (2021). Beyond First Encounters with Analytics: Questions, Techniques and Challenges in Instructors’ Sensemaking. LAK21.
- Lockyer, L., Heathcote, E., & Dawson, S. (2013). Informing pedagogical action: Aligning learning analytics with learning design. American Behavioral Scientist, 57(10), 1439-1459.
- Long, P. D., Siemens, G., Conole, G., & Gašević, D. (Eds.). (2011). Proceedings of the 1st International Conference on Learning Analytics and Knowledge (LAK’11). New York, NY: ACM
- Sonderland, Hughes & Smith (2018). The efficacy of learning analytics interventions in higher education: A systematic review. British Journal of Educational Technology, 50(5), 2594-2618.
- Wise, A. F. (2020). Educating Data Scientists and Data Literate Citizens for a New Generation of Data. Journal of the Learning Sciences, 29(1), 165-181.
- Wise, A. F., & Jung, Y. (2019). Teaching with analytics: Towards a situated model of instructional decision-making. Journal of Learning Analytics, 6(2), 53-69
- Wise, A. F., & Shaffer, D. W. (2015). Why theory matters more than ever in the age of big data. Journal of Learning Analytics, 2(2), 5-13.
Where to find data in your subject
There are many different places to view records of student activity in the Canvas LMS or integrated learning technologies. Records of student actions in the LMS will be a combination of actions in the Canvas spaces and the integrated learning technologies that have their own data records and analytics.
The following is a list of resources on where to view data that may be available in your subject.
Canvas LMS
- LMS - New Analytics
- LMS Quizzes
Videos
- Lecture Capture (Echo360)
- Kaltura
Other
- Poll Everywhere
- Cadmus
- Perusal
- Feedback Fruits
- Zoom
- Gradescope
- Readings Online
View reader statistics. For a more detailed report please lodge a Service Now request
Further support
For other data requests you are welcome to log a Service Now ticket to Learning Environments for more information, or assistance in obtaining data.