2024 Sustainability Report
Healthy ecosystems
DOMAIN: Walking the talk in our operations
Aspiration to 2030: The University’s campuses support a diverse range of species through healthy ecosystems on campus and connections to ecosystems off campus.
Progress against targets
| Target | Target status | Progress in 2024 |
|---|---|---|
| Each campus achieves no net loss of biodiversity relative to defined baseline years by 2025. |  On track |
|
| Each campus achieves an increase of biodiversity relative to defined baseline years by 2030. |  Not yet started |
|
Explore our progress
and our stories
Our progress
Biodiversity Baseline Data Project – data collection completed
In 2019, the University began the Biodiversity Baseline Data Project (BBDP) to calculate Biodiversity Baselines for all campuses. The aim of the project is to better protect, enhance, and expand on campus biodiversity. The project informed the ambitious commitments in the SP2030 to achieve no net loss of biodiversity by 2025 and a net gain by 2030.
Metrics Image Gallery
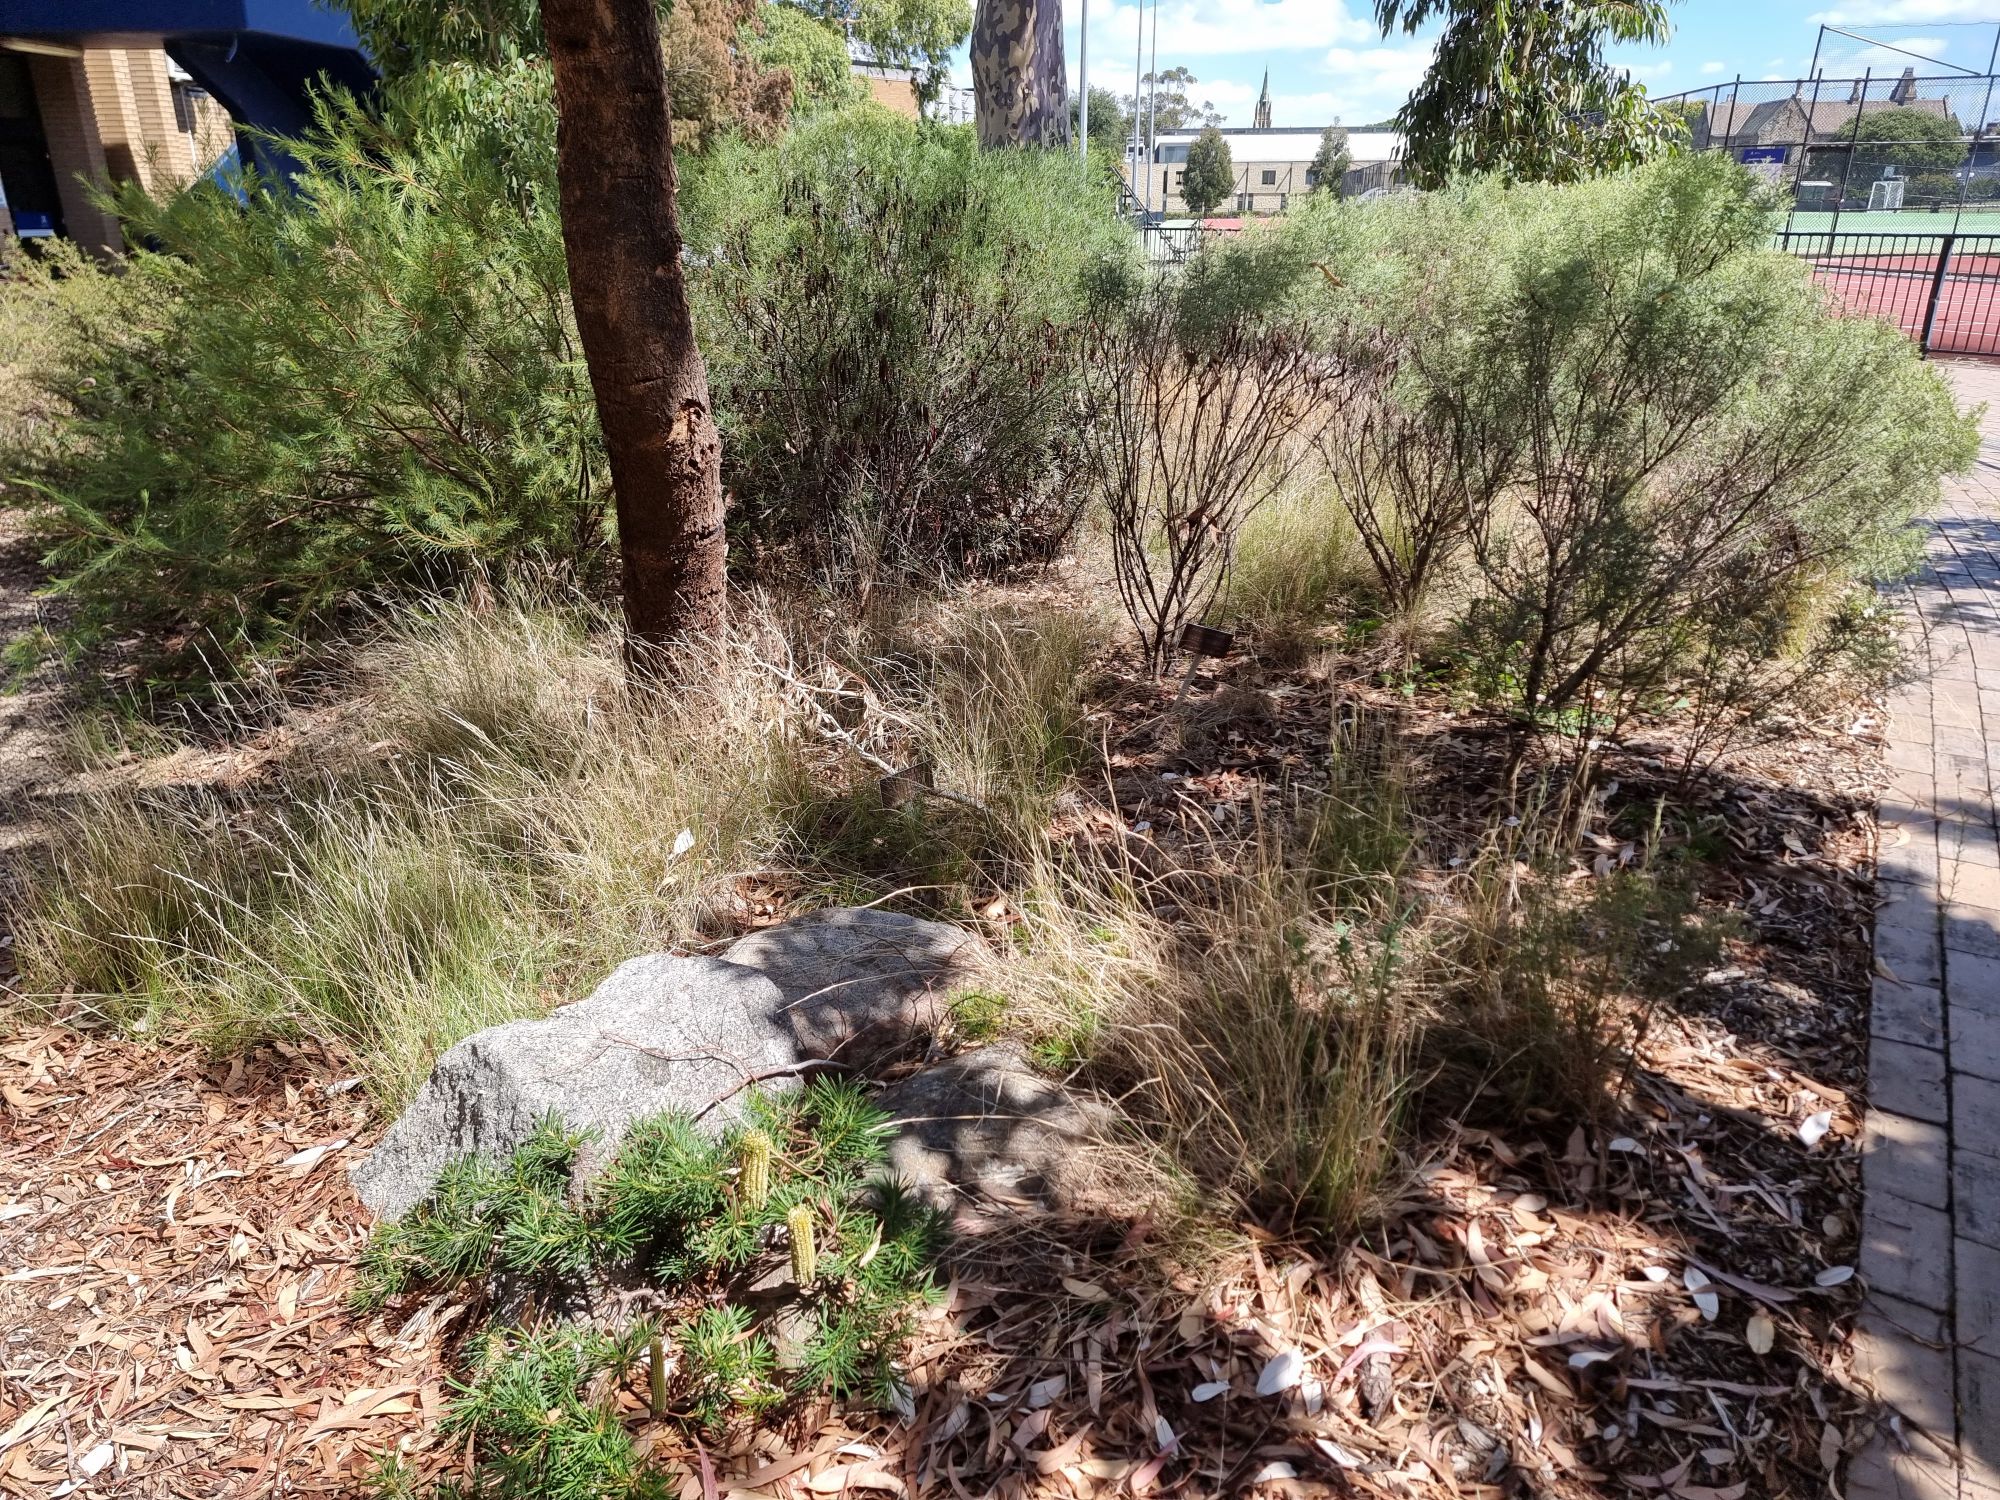

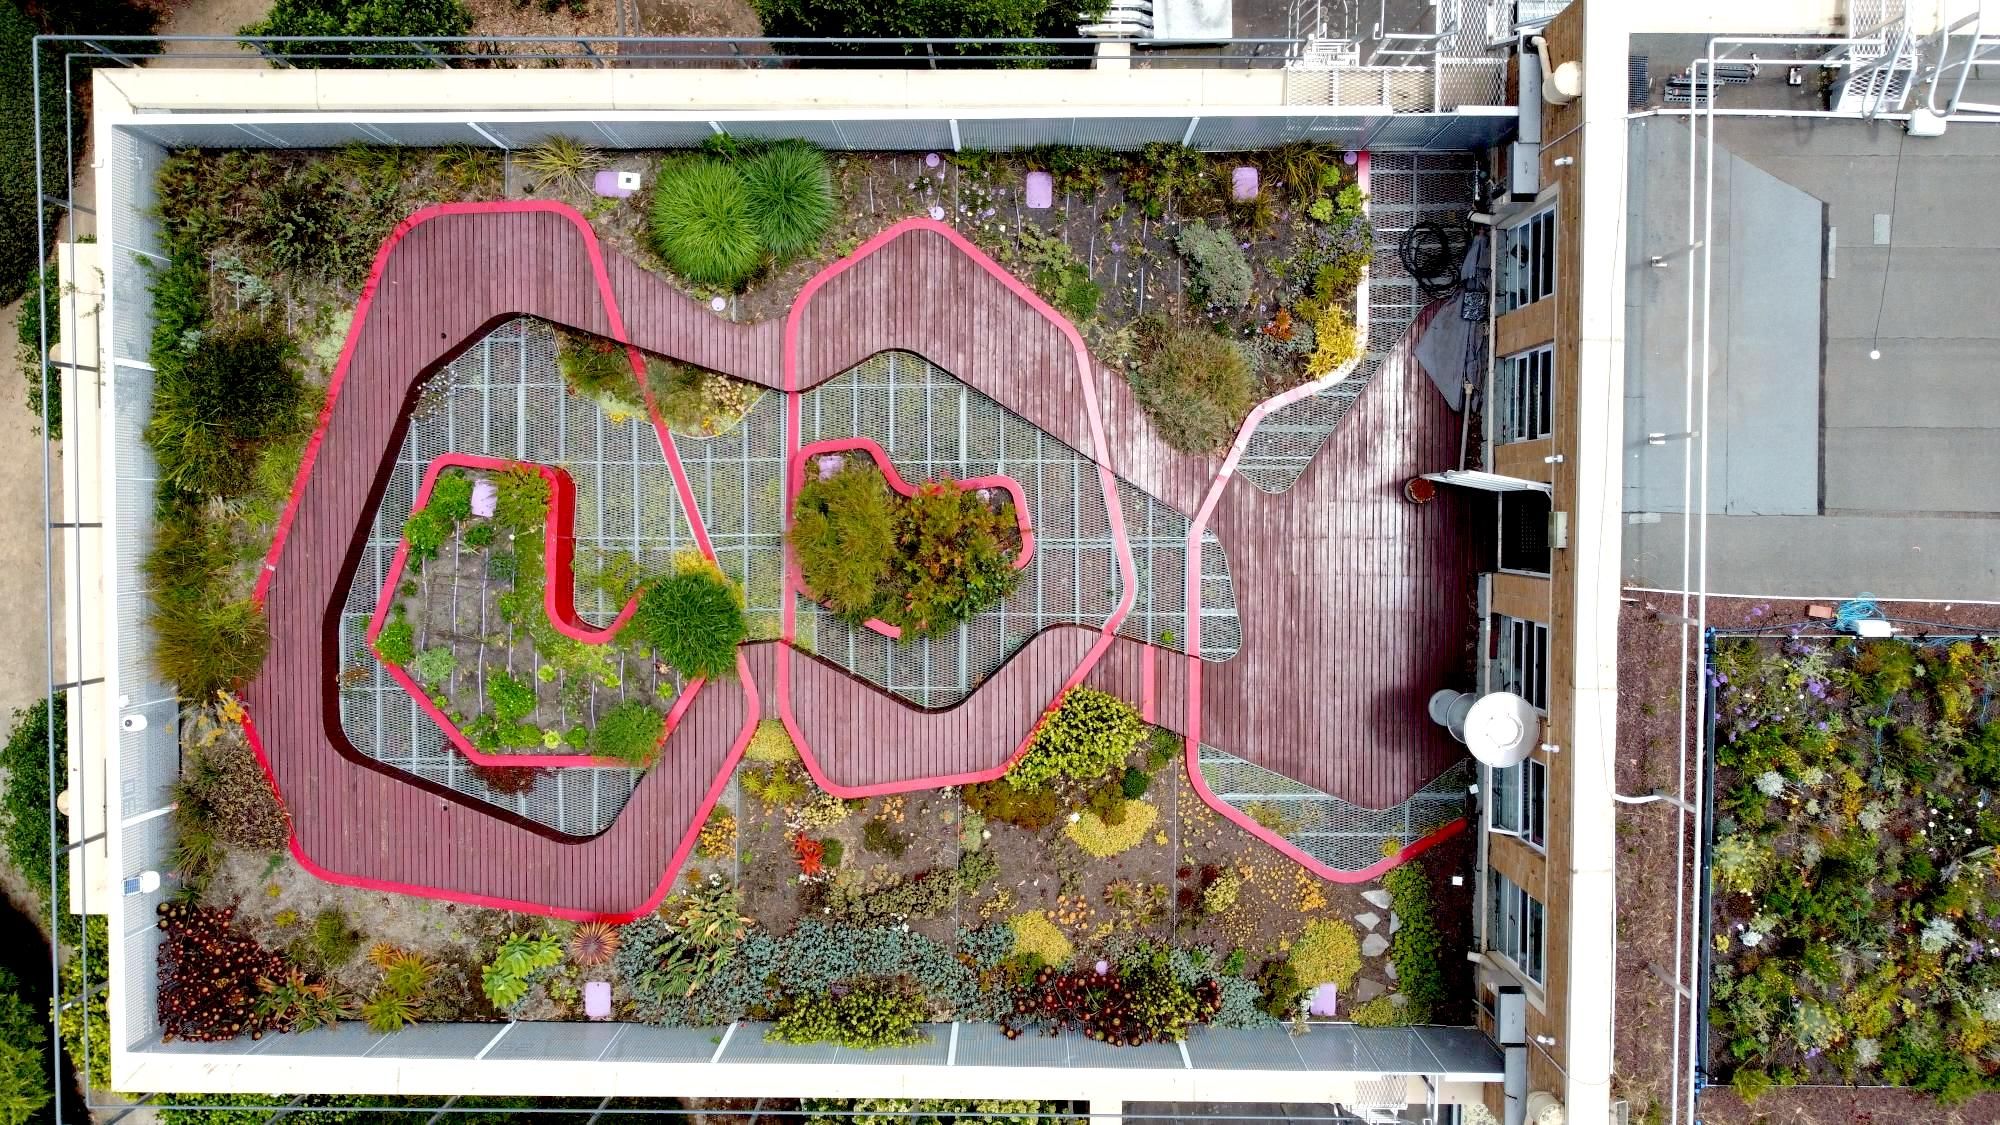
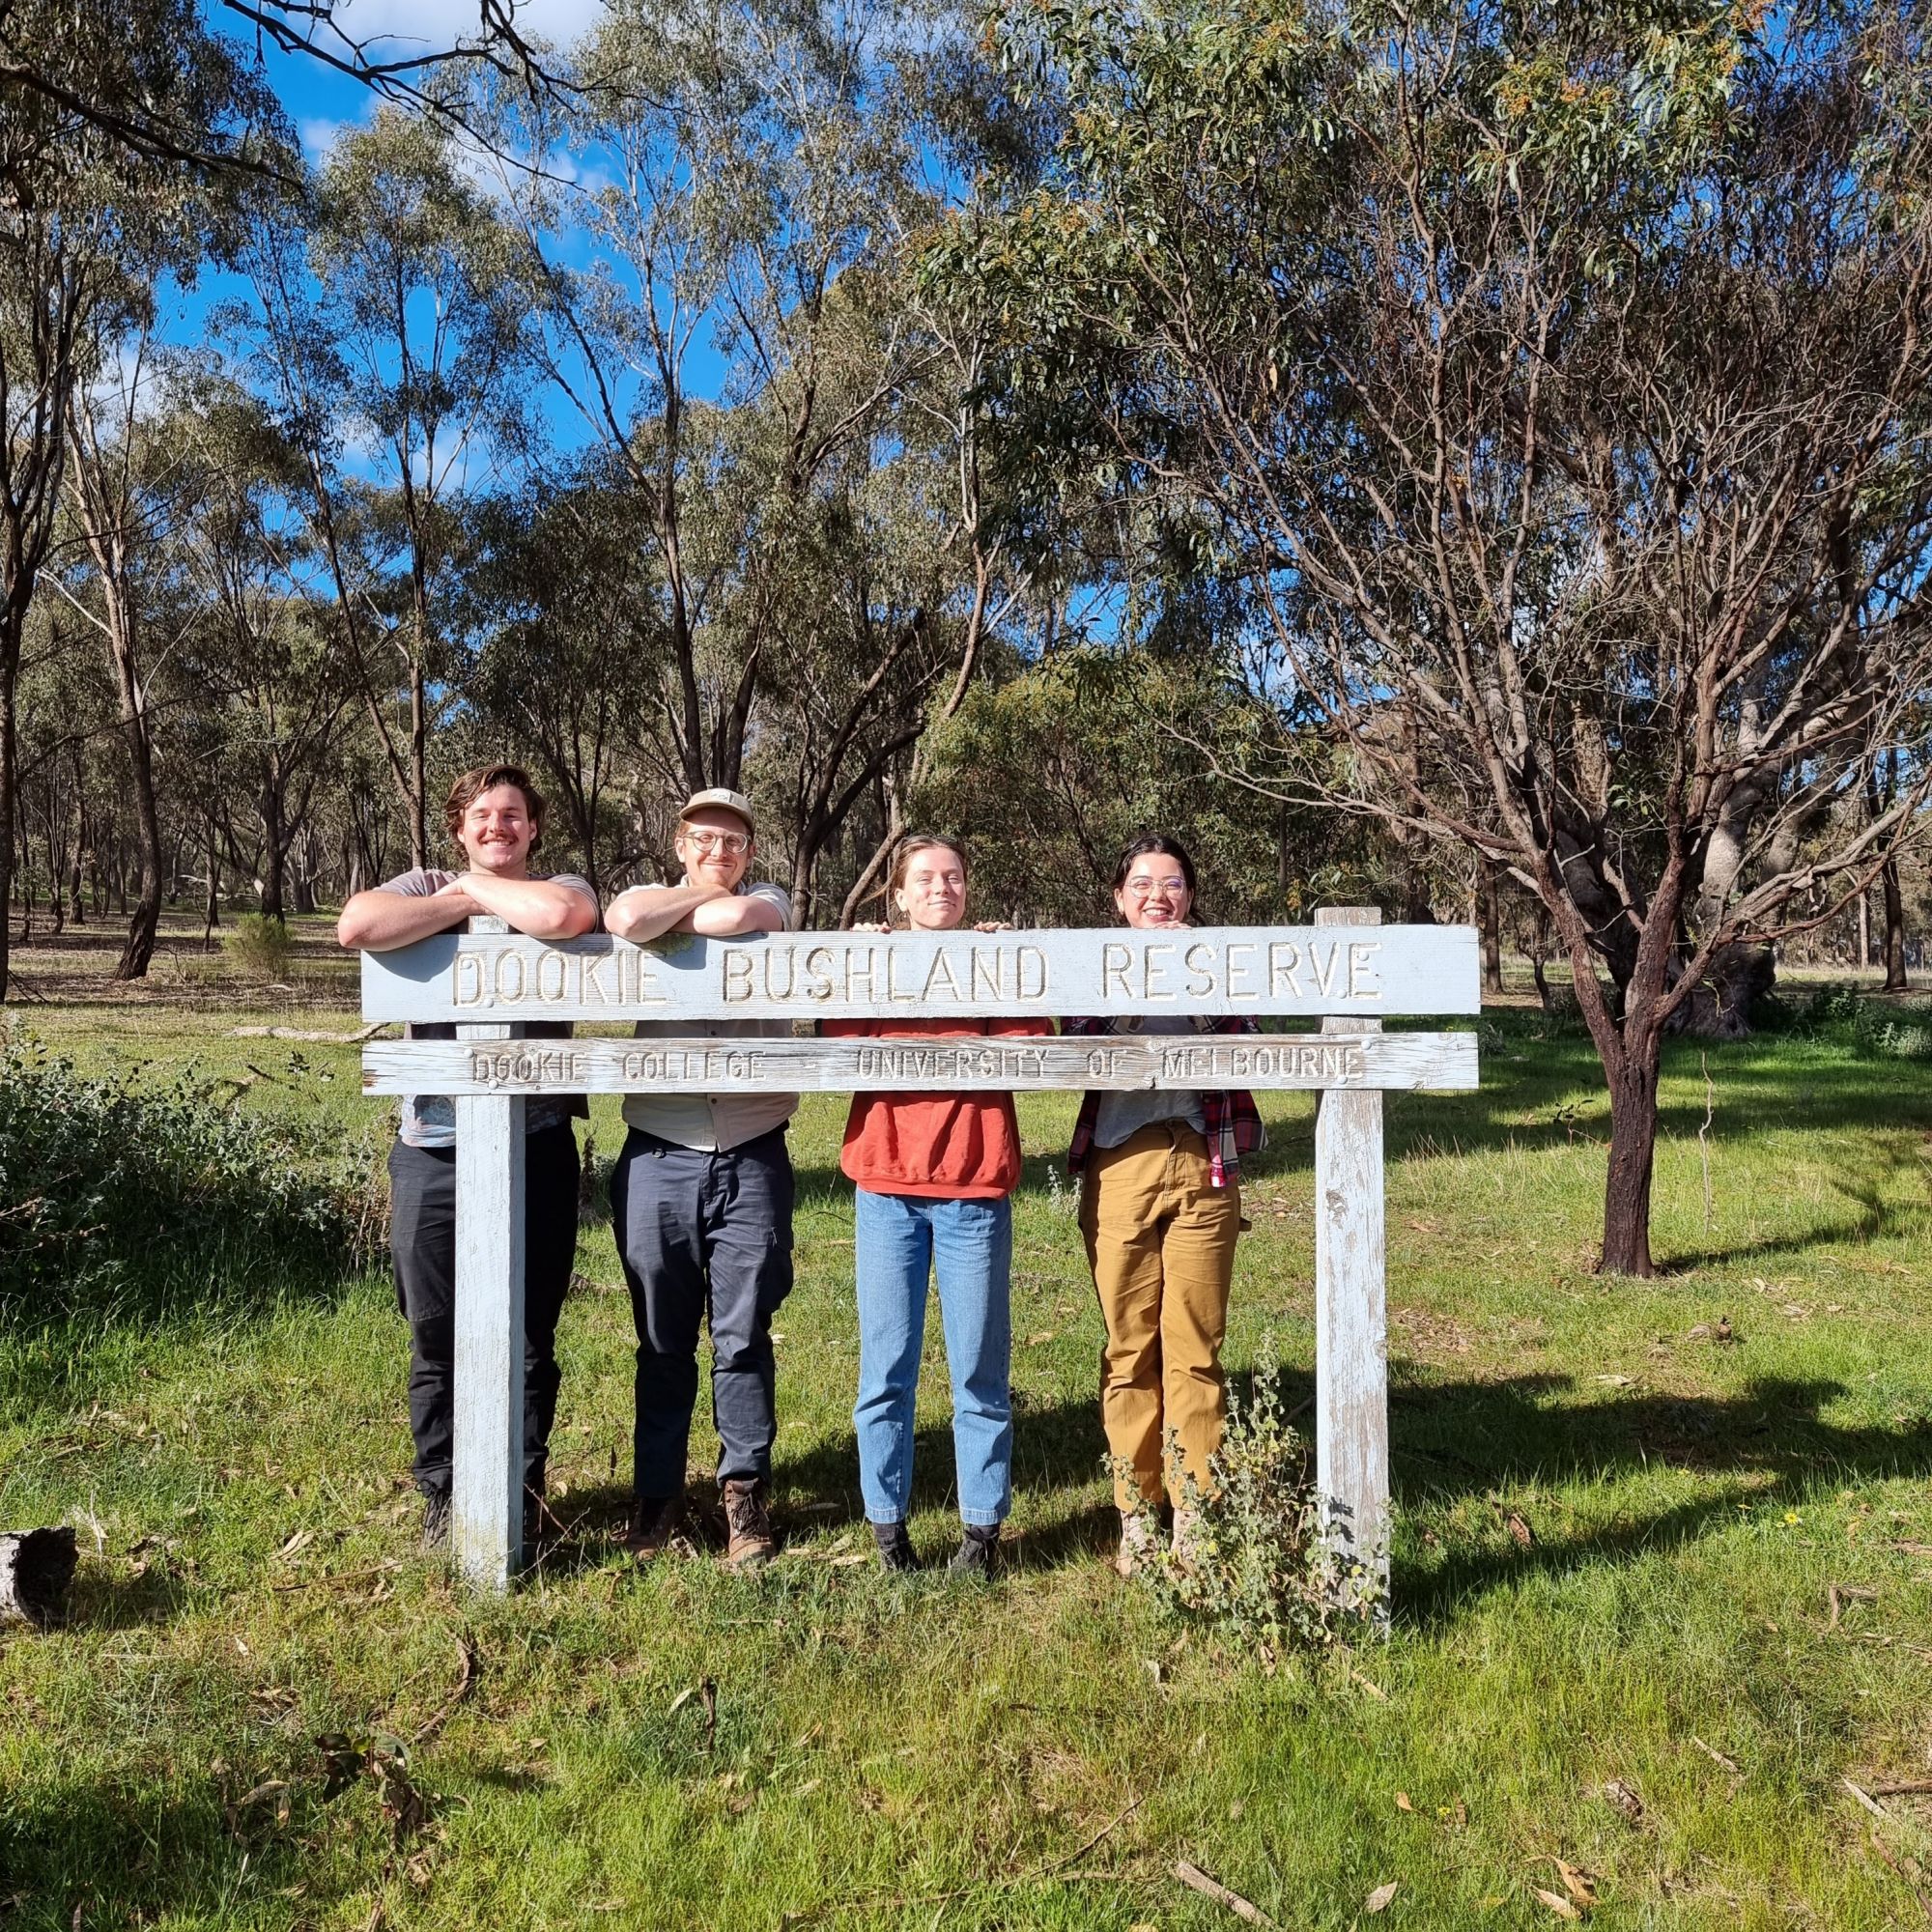


Data collection for seven preliminary metrics of the BBDP was completed in 2024. Baseline years differ based on data availability. Image below shows the baseline values for each of the seven metrics on the Parkville campus.

The successful completion of this project has relied on the collective efforts of academics, students, and community members. Thirty-eight subject cohorts across 20 different subjects have contributed to projects that deepen our understanding of biodiversity, engaging and inspiring an estimated 1,500 students over the past six years. Interns have also played a crucial role, with 22 students dedicating over 4,366 placement hours through the Sustainability Internship program. Additionally, 15 paid student casuals worked one to two days a week over several months, further driving the project forward.
The BBDP’s impact extends beyond the University, offering an adaptable framework for other institutions and fostering collaboration to protect Australia’s biodiversity. Its success was recognised at the 2024 Green Gown Awards Australasia, where it received a Highly Commended in the inaugural Nature Positive category.
In 2025, we will build on this momentum, refining the baselines and assessing biodiversity losses to identify the necessary steps to achieve the University’s no-net-loss commitment.
Metric 1: Plantable Area (m2)
In 2024, $250,000 was committed to get detailed Feature and Level Surveys of the Southbank, Burnley, Werribee, Creswick and Dookie campuses. This work concludes initial campus data collection efforts for Metric 1 data.
From these and other Feature and Level Surveys data was extracted to calculate Total Plantable Area (m2) for each of the University’s eight campuses. The table below summarises the Metric 1 baseline values for each campus and the percentage of each campus that is ‘Plantable’.
Metric 1 biodiversity baseline values
| Campus | Baseline Year | Plantable Area (%) |
|---|---|---|
Parkville | 2018 | 16% |
Southbank | 2024 | 12% |
Burnley | 2024 | 63% |
Werribee | 2024 | 68% |
Creswick | 2024 | 76% |
Shepparton | 2024 | 40% |
Dookie | 2024 | 98% |
Fishermans Bend | 2017 | 7% |
This data has undergone some preliminary analysis which is published as a publicly-accessible interactive dashboard. Not all plantable area is equal in terms of its ability to support biodiversity. So, to provide a more in-depth understanding, the analysis includes categorisation of different types of plantable areas such as garden beds, lawns, ponds, etc. For example, the map below includes an excerpt from the Metric 1 Dashboard of the Dookie campus.

In 2025, the University plans to:
- Continue data collection, processing and conduct further analysis, working towards a Metric 1 value at an estate level
- Develop a method to apply a biodiversity score and an amenity score to certain plantable areas to aid in the prioritisation of investment into landscape renewal projects
- Draft a report detailing the approach to quantifying this metric to be shared with the ACTS Biodiversity Working Group and Nature Positive Universities Network.
Our stories
Encouraging the University community to explore, celebrate, and help protect on-campus biodiversity
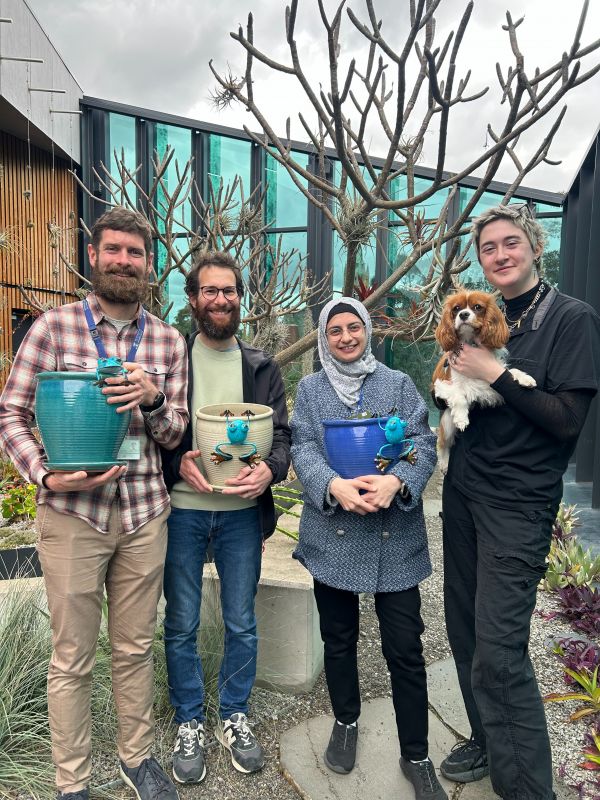
Biodiversity Month takes place every September, with Australia celebrating its unique and rich biodiversity. In 2024, the University’s Sustainability team ran a month-long BioBlitz accompanied by a series of biodiversity-themed events aimed at inspiring the University community to ‘explore, celebrate, and help protect’ on-campus biodiversity.
Over 125 people attended the events throughout September and 169 people participated in the BioBlitz, which generated 1,472 observations of on-campus biodiversity from 264 different species. Participants submitted their sightings of on-campus fauna and fungi using iNaturalist, a platform where the naturalist community works together to record and identify observations of biodiversity. The data collected from this and other BioBlitz’s contributes to the University’s understanding of which fauna and fungi it needs to protect on its campuses, tracked using Metric 7: Number of Fauna & Fungi Species of the Biodiversity Baseline Data Project.
Observations from iNaturalist are shared to the Atlas of Living Australia database, an open access database that contains over 9,500 datasets and over 145 million occurrence records from across Australia. The University is currently developing an application to directly analyse relevant data from the atlas in ‘real-time’ to assist us to track performance against Metric 7. The project is a part of the Campus Living Lab Accelerator Program Pilot, receiving $10,000 funding to assist in its development. The application is scheduled to launch to the public mid-2025.
Our sustainability strategy
At the University of Melbourne, our efforts in sustainability are guided by Sustainability Plan 2030 - a roadmap for sustainable delivery of our institutional strategy Advancing Melbourne.
Read more about how we are advancing sustainability at the University:
